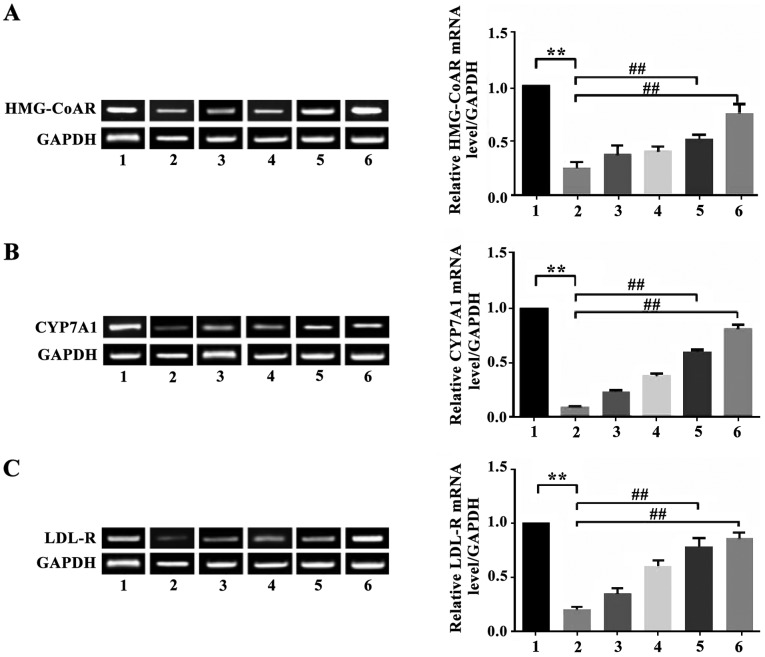
Figure 1.
Expression of LDL-R. Based on a comparison with the control group, P<0.01; **Based on a comparison with the model group, ##P<0.01. Lane 1, control group; lane 2, model group; lane 3, low-dose apigenin group; lane 4, moderate-dose apigenin group; lane 5, high-dose apigenin group; lane 6, simvastatin group.

