Figure 1.
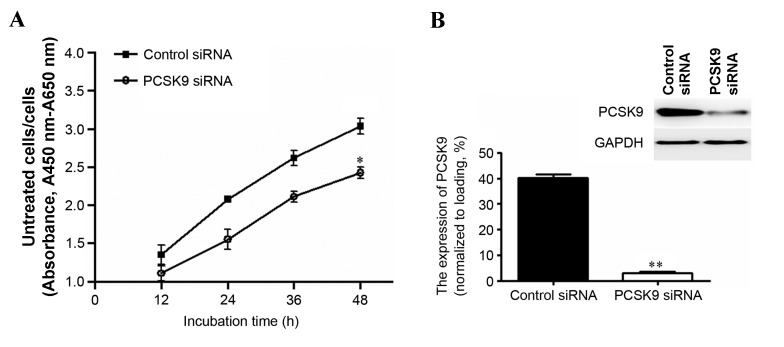
Proliferation of A549 cells was inhibited by PCSK9 siRNA. (A) A549 cells were transfected with PCSK9 siRNA or control siRNA for the indicated durations. Cell proliferation was examined using the Cell Counting Kit-8 assay. The optical density of each well was measured at 450 and 650 nm using a microplate reader. Values are expressed as the mean ± standard deviation of A450-A650 at 12, 24, 36 and 48 h of siRNA transfection (each concentration was tested in triplicate). (B) Expression of PCSK9 in A549 cells following siRNA transfection. The level of PCSK9 was significantly decreased following RNA interference. GAPDH was included as a loading control. Values are expressed as the mean ± standard deviation (n=3). *P<0.05 vs. control siRNA; **P<0.001 vs. control siRNA group. A650 was assigned as internal control; A450 was assigned as the examining wavelength. siRNA, small interfering RNA; A650, absorbance at 650 nm; A450, absorbance at 450 nm; PCSK9, proprotein convertase subtilisin/kexin type 9.

