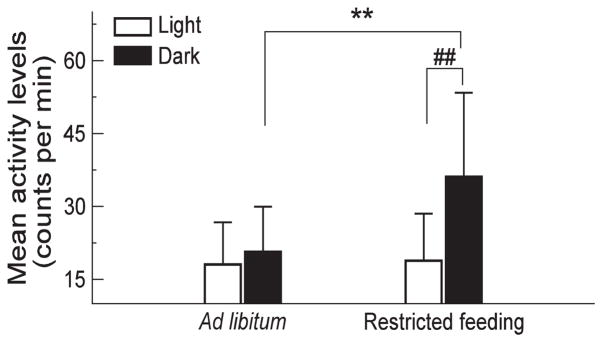
Figure 2.
Group averages of mean activity levels during the light phase and during the dark phase. Restricted feeding caused a significant increase in the mean activity levels during the dark phase (indicated by **: p<0.01) but not during the light phase. Such effects of restricted feeding led to a significant light-dark rhythm (indicated by ##: p<0.01).

