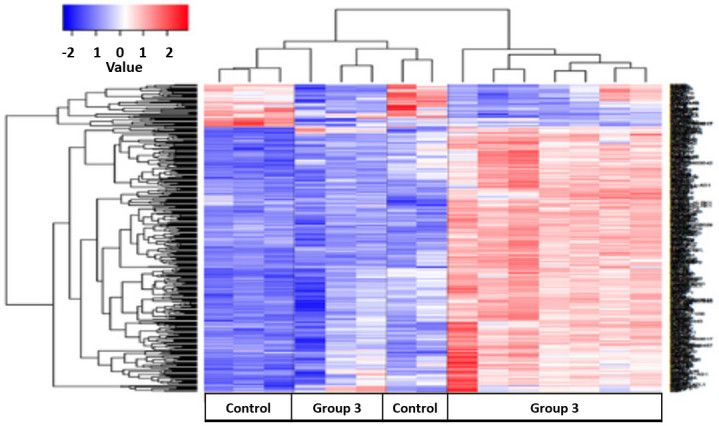
Figure 5.

Results of cluster analysis between healthy control and 1-year follow-up, treated tuberculosis patients (Group 3). The color key shows the gene expression fold change in the healthy control group compared with Group 3, respectively: −2 represents a decrease in expression; 0 represents equivalent expression levels; and +2 represents an increase in expression.
