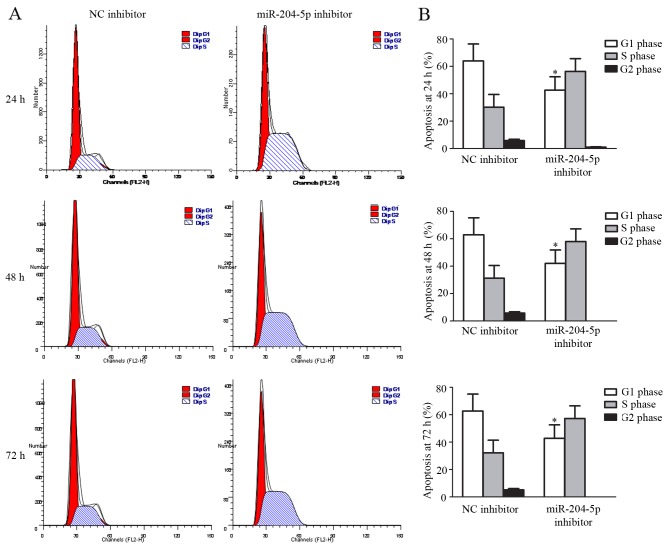
Figure 5.
Induction of JAR cell cycle change. (A) Cell cycle distribution following hypoxia treatment for 24, 48 and 72 h. (B) Percentage of JAR cells in cycle in S, G1 and G2 phases following 48 h of hypoxia. Data are presented as the mean ± standard deviation. All experiments were repeated independently three times. *P<0.05 vs. G1 phase arrest in NC group at the same time point. NC, normal control; miR, microRNA.

