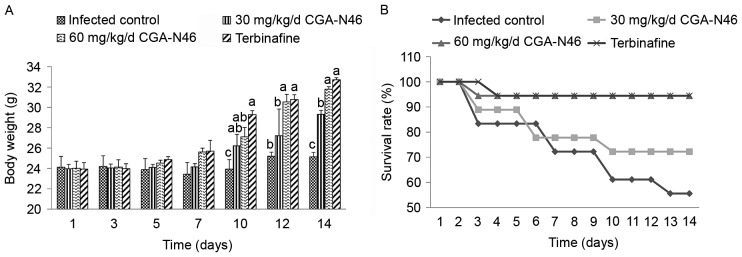
Figure 1.
The average body weights of (A) the survival mice and (B) the survival rates of each tested group. Data were represented as mean ± SEM. Differences between groups were considered to be statistically significant at P<0.05 and shown as different letters. The different letter above the bar means significant difference between groups. The same letter above the bar means no significant differences.

