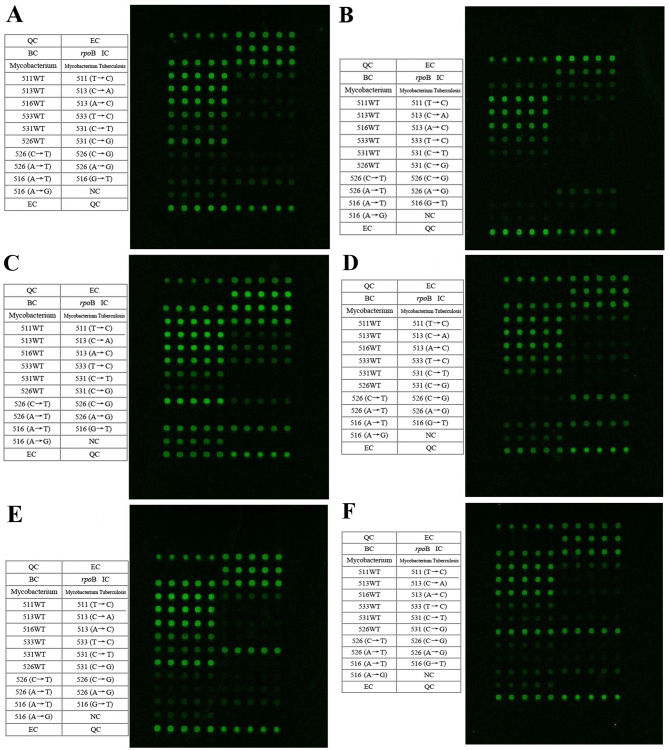
Figure 1.
Detection spectrums of the microarray chip for the rpoB-RRDR relevant mutation points. The microarray chip spectrums present the samples with mutation(s) at: (A) WT MTB rpoB-RRDR 511, 513, 516, 526, 531 and 533, (B) MTB rpoB-RRDR 526 (CAC→CGC), (C) MTB rpoB-RRDR 526 (CAC→TAC), (D) MTB rpoB-RRDR 526 (CAC→GAC), (E) MTB rpoB-RRDR 531 (TCG→TTG) and (F) MTB rpoB-RRDR 531 (TCG→TGG). The contents of the table on the left side correspond to the microarray hybridization dot matrix on the right side in each figure. Every five repeated hybrid grid points correspond to one cell of specific content. RRDR, rifampicin resistance-determining region; MTB, Mycobacterium tuberculosis; QC, chip preparation quality control; EC, chip hybridization quality control; BC, blank comparison quality control; IC, targeted gene amplification quality control; WT, wild type.

