FIG. 3.
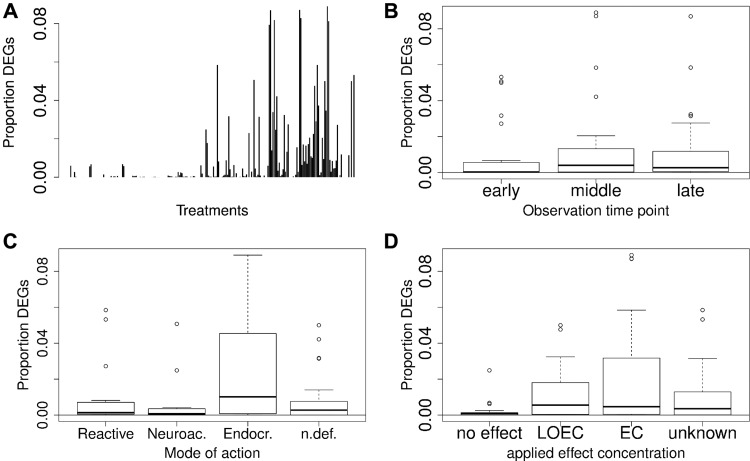
Proportion of differentially expressed genes (DEGs) among all measured genes in respective treatments: A, Individual experiments, each bar represents one individual treatment. B, Subgroups according to observation time points. C, Mode of action subgroups. D, Subgroups according to the applied effect concentrations.

