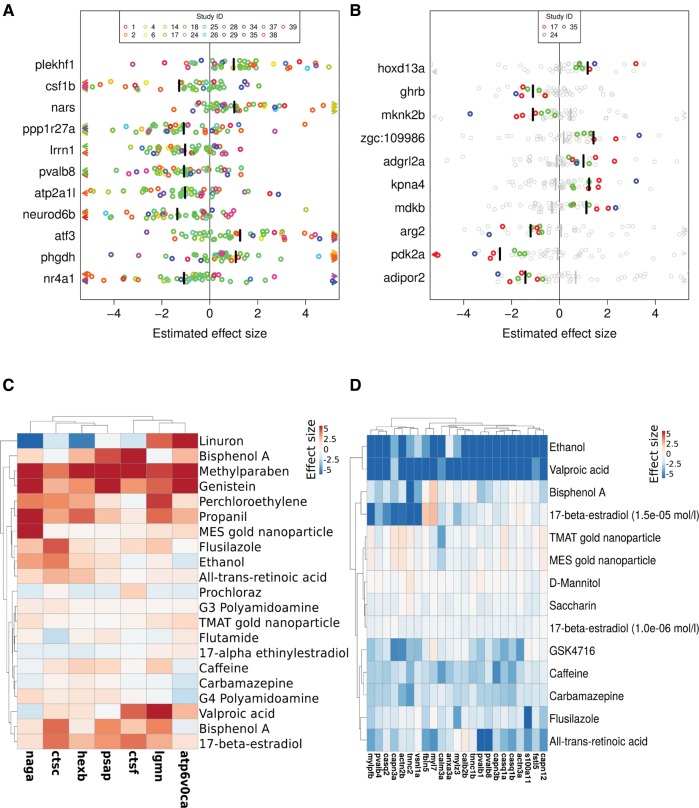
FIG. 4.
Estimated effect sizes for selected meta-genes (= genes significantly differentially expressed in a subgroup as indicated by effect size analysis). Values above 0 = increased expression after chemical exposure, values below 0 = decreased expression after chemical exposure. A, Meta-genes for all experiments. B, Top 10 meta-genes in the subgroup of experiments with neuroactive substances. C, Meta-genes associated with the lysosome pathway (KEGG) in the EC subgroup (exposures with concentrations causing apical effects). D, Meta-genes associated with calcium binding (GeneOntology annotation) in the subgroup of early exposures. A, B, Circles represent single effect sizes, arrows single effect sizes smaller −5 or larger 5, colors represent study affiliation, bars summary effect sizes, grey circles and bars single effect sizes and summary effect sizes of experiments not in the group, Study IDs as given in Table 1. C, D, values clipped below −5 and above 5.

