Figure 6.

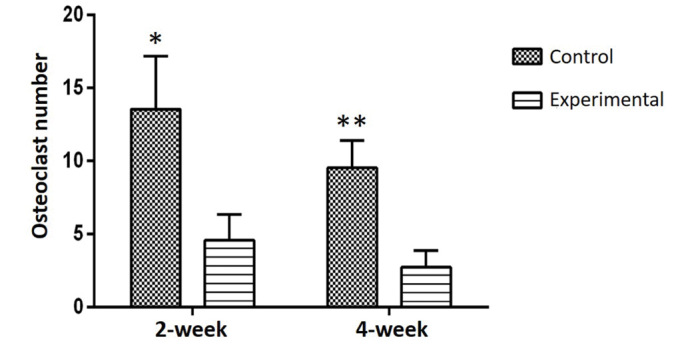
Histomorphometric analysis of osteoclastic activity was higher in the control groups compared with the experimental groups *P<0.05, ** P<0.05 vs. experimental groups.

Histomorphometric analysis of osteoclastic activity was higher in the control groups compared with the experimental groups *P<0.05, ** P<0.05 vs. experimental groups.