
Figure 4.
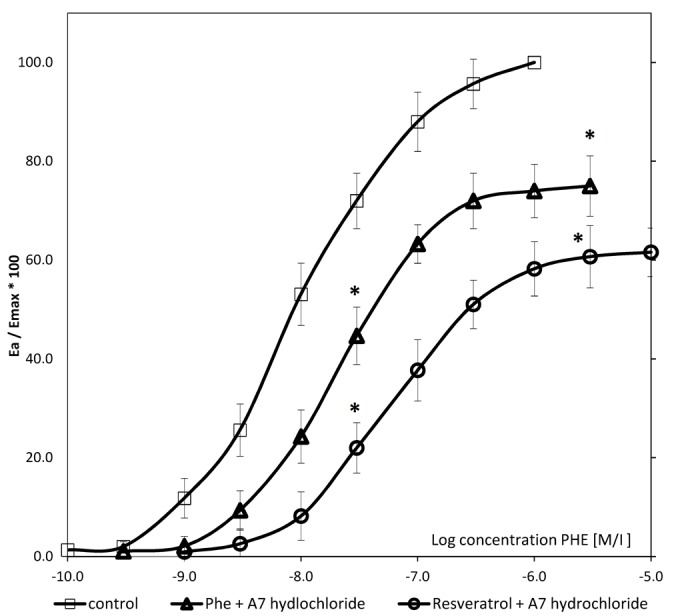
Concentration-response curves in arteries with vascular endothelium obtained for PHE in the resveratrol-pretreated group in the presence of A7-hydrochloride, PHE control and PHE/A7 hydrochloride control. Data are presented as mean ± standard deviation. For values between 20–80%, P<0.05. *P<0.001 vs. control. PHE, phenylephrine; Emax, maximal response.