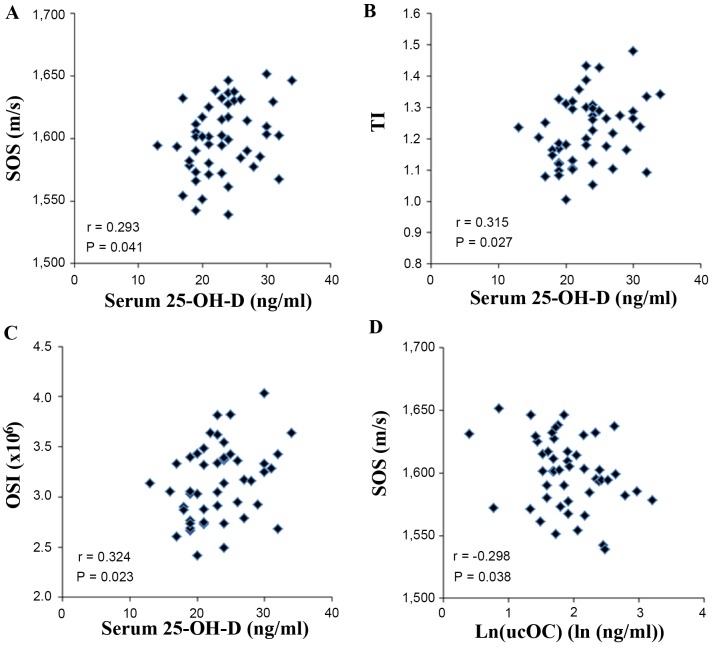
Figure 1.
Correlations between serological markers and QUS parameters. (A) Serum 25-OH-D and SOS, (B) serum 25-OH-D and SOS, (C) serum 25-OH-D and (D) Log transformed serum ucOC and SOS. P<0.05 represents a statistically significant difference. 25-OH-D, 25-hydroxyvitamin D; SOS, speed of sound; ucOC, undercarboxylated osteocalcin.

