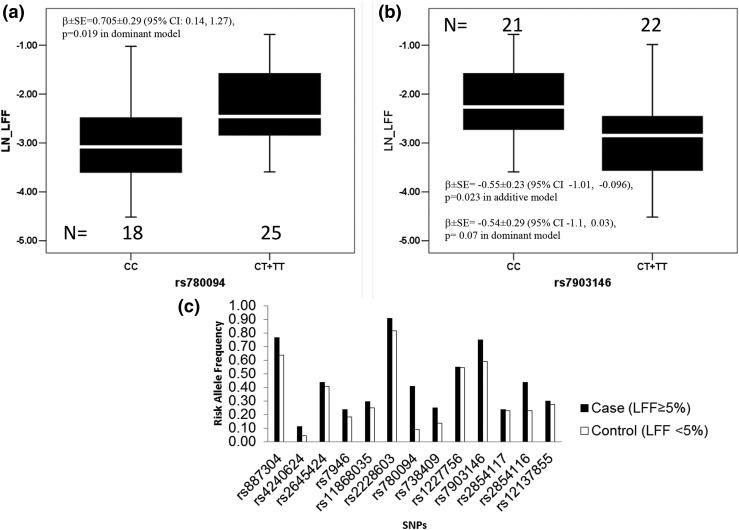
Figure 2.
Distribution of LFF in genotypic groups (a and b) observed are shown in the upper panel. A bar graph (c) shows the risk allele frequency in subjects with <5% (control) and >5% (case) LFF on the bottom panel. Sixteen SNPs were analyzed, and 13 were polymorphic in this study. The box represents the interquartile range, which contains 50% of the values. The whiskers are lines that extend the box to the highest and lowest values, excluding outliers. A line across the box indicates the median. CC, homozygous for the major allele; CT + TT, heterozygous and homozygous for the minor allele; LN_LFF, natural logarithm of liver fat fraction; SE, standard error.

