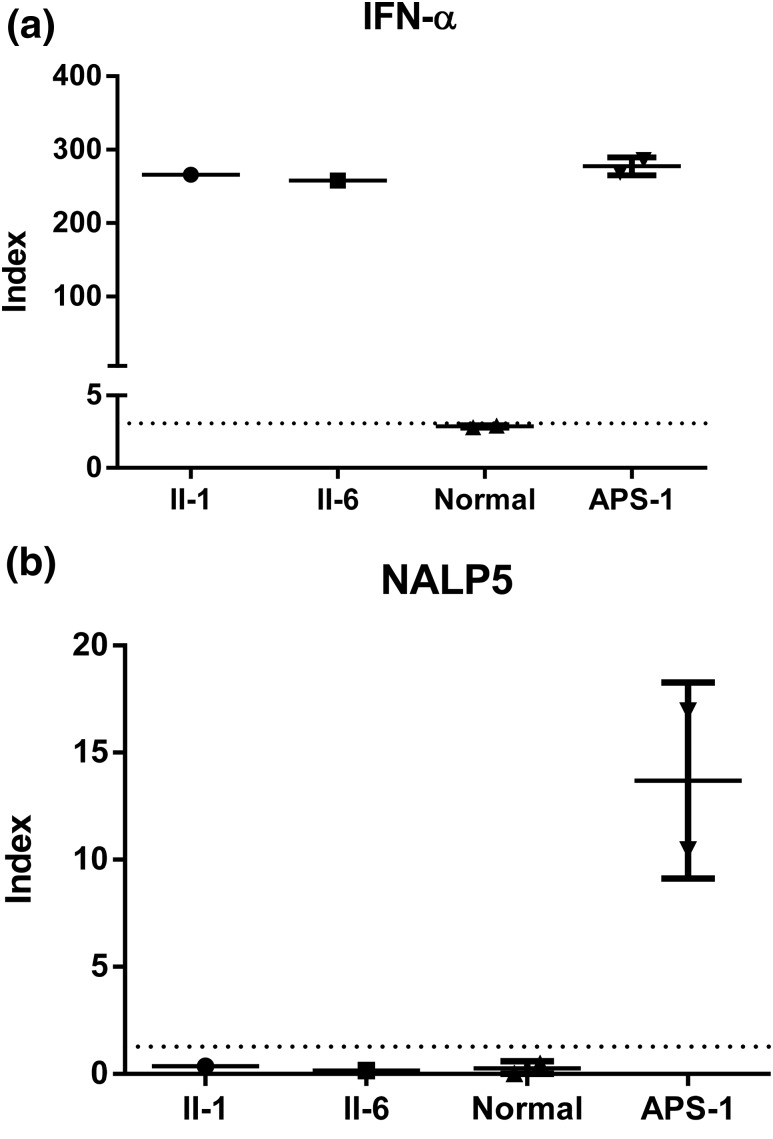
Figure 2.
Analysis of IFN-α and NALP5 autoantibodies. Sera from patients (II-1 and II-6), normal control subjects, and patients with APS-1 were tested for the presence of autoantibodies to IFN-α (a) and NALP5 (b). Sera were tested in duplicate. Dotted line represents 3 standard deviations above the mean value of the normal control sera.

