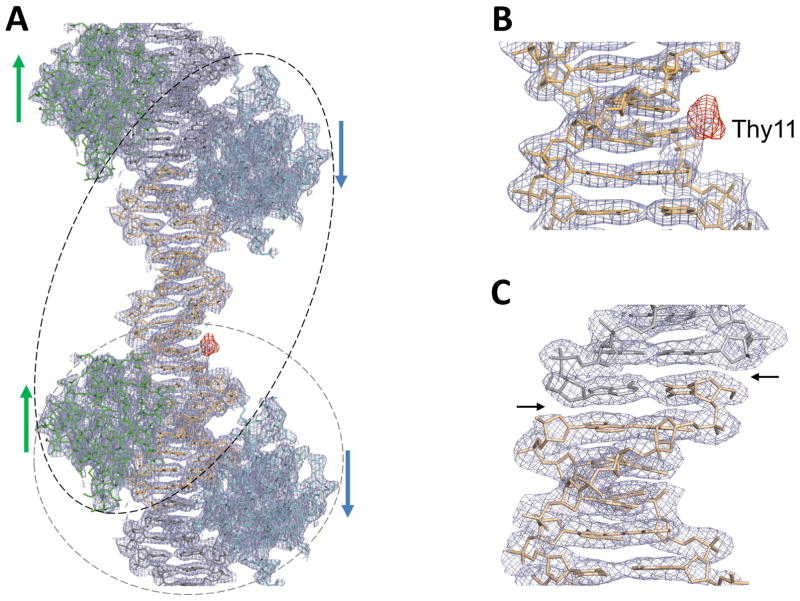
Figure 2. Overall structures of the FoxO1-DBD-21mer DNA complex and verification of DNA sequence assignment of the pseudo-continuous helix within the crystal lattice.
(A) Overall electron density maps of the 21mer structure at 2.3 Å resolution (the final 2Fo-Fc map (gray mesh) contoured at 1σ calculated with the phases from the final model and the difference map (red mesh) contoured at 3σ calculated with iodine-labeled crystals using the coefficient Fiodine-Fnative and the phases from the final native model). (B) A zoomed-up view of the difference map, together with the final 2Fo-Fc map, clearly displaying a strong peak at the expected position of CH3 group of Thy11 nucleotide. This difference map unequivocally highlights the correct position of iodine. (C) A zoomed-up view of the electron density breaks at the ends of the overhang DNA construct used in crystallization. Break points are indicated by black arrows.

