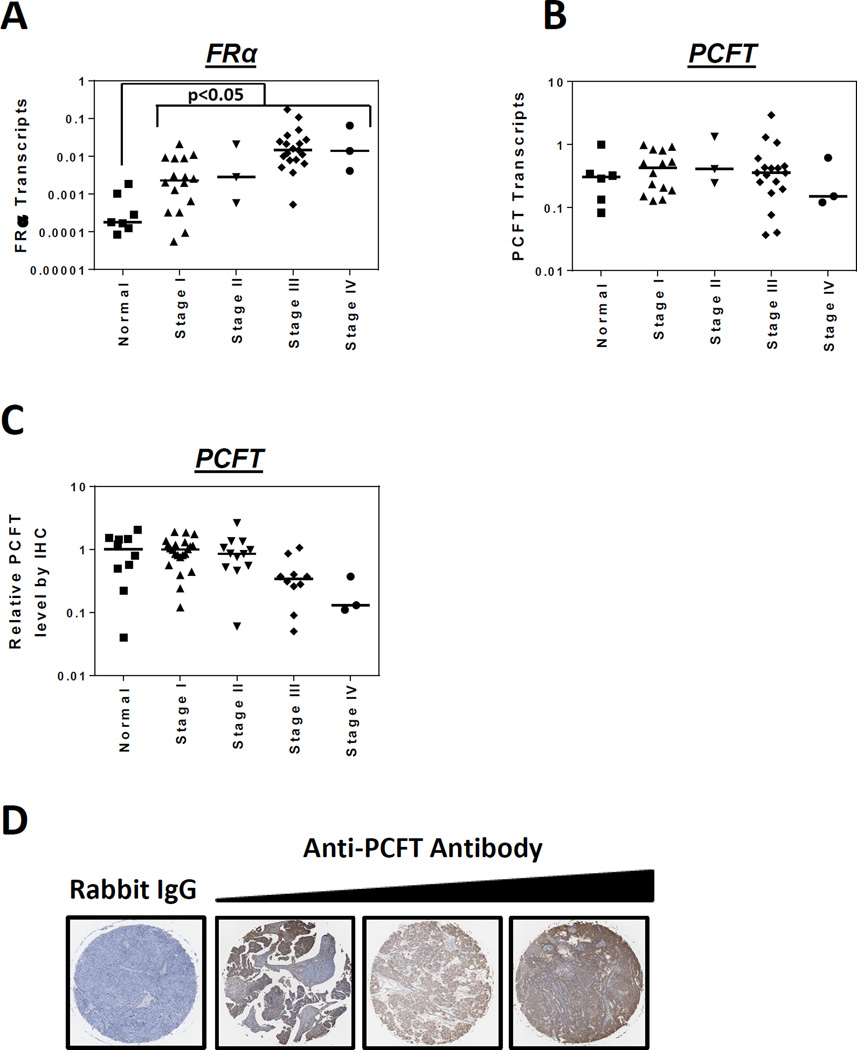
Figure 2. Expression of FRα and PCFT in primary epithelial ovarian cancer (EOC) specimens.
Transcript levels for FRα (Panel A) and PCFT (Panel B) in 7 normal ovary and 41 EOC specimens from patients at different disease stages (Origene) were measured by real-time RT-PCR. FRα and PCFT transcript levels were normalized to transcript levels for β-actin. IHC staining of PCFT was performed with 47 EOC specimens and 10 normal ovary tissues from a commercial TMA (US Biomax, Inc.). The TMA was incubated with affinity-purified PCFT-specific antibody or rabbit IgG, the slides developed, counterstained and mounted, as described in Materials and Methods. The slides were scanned at 20X by an Aperio Image Scanner (Aperio Technologies, Inc.) for microarray images. The total intensity of antibody positive staining of each tissue core was computed and plotted as a relative value with the median value for the normal ovary specimens assigned a value of 1 (Panel C). Statistical significance between the groups was analyzed by the Mann-Whitney t test. Median values are shown as cross bars. Representative images are shown in Panel D for EOC specimens incubated with IgG (specimen 35 in Table S2, Supplemental Data) and PCFT-specific antibody, with low, intermediate and high level staining (left to right, specimens 49, 21, and 29, respectively, in Table S2, Supplemental Data), corresponding to stages II, IIIC, I and IB, respectively.

