
Figure 5.
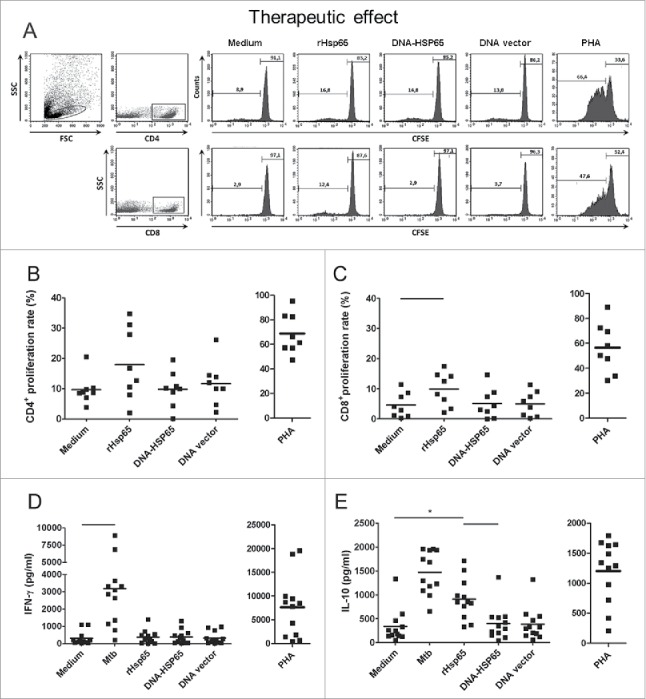
TB patients cell proliferation response and cytokine secretion after Hsp65 antigen stimulation. PBMC cultures from untreated and treated TB patients were performed as described in Figure 4. (A) Representative FACS plot of cells gated as lymphocytes by FSC and SSC and dot plots for CD4+ or CD8+ cells were analyzed. Histograms show proliferation rate after different stimulus. (B) CD4+ cell proliferation rate. (C) CD8+ cell proliferation rate. (D) IFN-γ secretion. (E) IL-10 secretion. Horizontal lines represent the mean value of 8 to 12 untreated patients. *p < 0.05 compare with all stimulus. Bars p < 0.05 compare with linked stimulus.