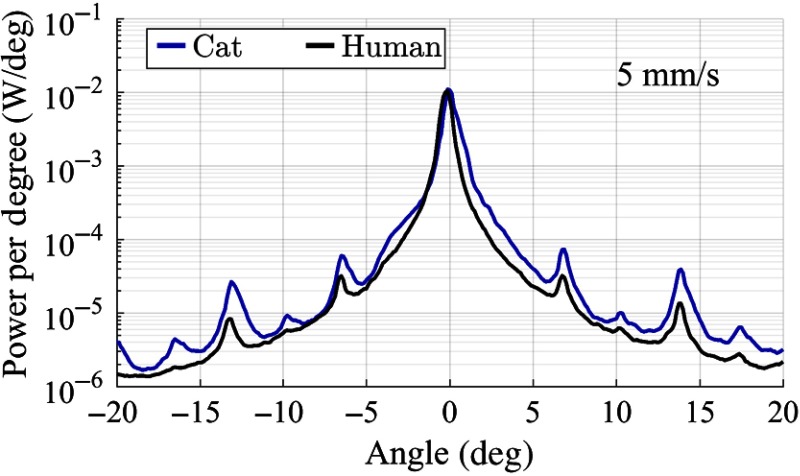
Fig. 3.
Diffraction patterns used to calculate RI change in cornea. The power meter used in the custom diffractometer (Fig. 2) scans across a hemisphere ranging from to , collecting the power at 0.125 deg intervals. As well as the diffraction pattern from the blue-IRIS phase gratings, the scans also collect the intrinsic corneal scatter. This background scatter can clearly be seen in the figure as the wide central peak. The first-order diffraction efficiency is used to calculate RI change. A higher diffraction efficiency indicates a higher magnitude of RI change.

