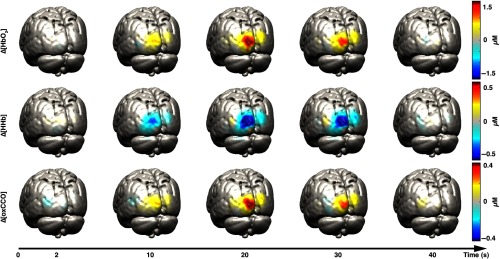
Fig. 4.
Examples of reconstructed (first row), (second row), and (third row) images on the GM surface mesh at five different time points for participant 1. The selected time points are 2, 10, 20, 30, and 40 s after stimulus presentation. Images were mapped to the MNI152 GM mesh for visualization purposes.

