
Fig. 5.
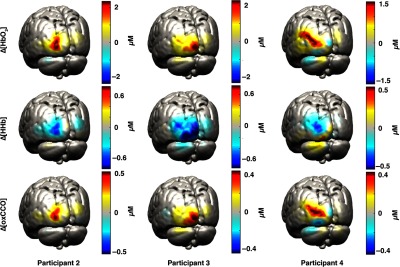
Examples of reconstructed (first row), (second row), and (third row) images on the GM surface mesh for participant 2, 3, and 4. The reconstruction for 20-s poststimulus onset is displayed.
Official websites use .gov
A
.gov website belongs to an official
government organization in the United States.
Secure .gov websites use HTTPS
A lock (
) or https:// means you've safely
connected to the .gov website. Share sensitive
information only on official, secure websites.
Examples of reconstructed (first row), (second row), and (third row) images on the GM surface mesh for participant 2, 3, and 4. The reconstruction for 20-s poststimulus onset is displayed.