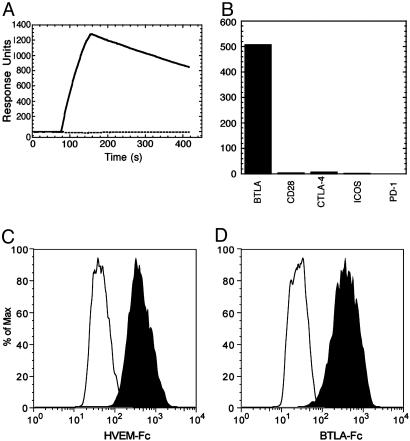
Fig. 1.
HVEM binds BTLA. (A) The sensorgrams represent binding of HVEM-Fc to immobilized BTLA-Fc (solid line) or control Fc-fusion protein (dashed line). (B) SPR-binding responses of HVEM-Fc to immobilized CD28 family members. Binding of HVEM-Fc (C), BTLA-Fc (D) (both shaded black), or Fc-fusion control protein (all at 500 nM) to BTLA-expressing (C) or HVEM-expressing (D) AD-293 cells, detected by flow cytometry.

