Figure 5.

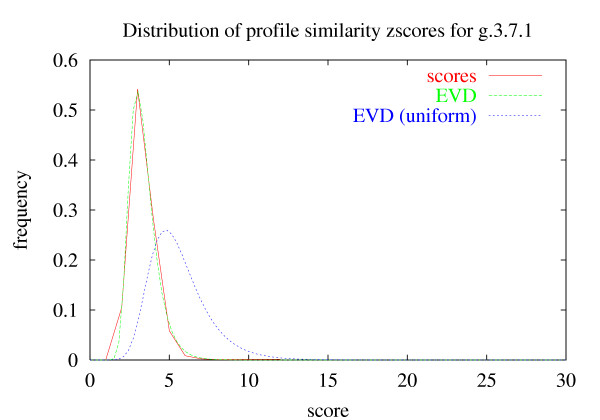
Distribution of profile similarity scores. The per-family distribution can differ quite markedly from the overall distribution of scores due to unique composition effects, etc, as is demonstrated for the g.3.7.1 family.

Distribution of profile similarity scores. The per-family distribution can differ quite markedly from the overall distribution of scores due to unique composition effects, etc, as is demonstrated for the g.3.7.1 family.