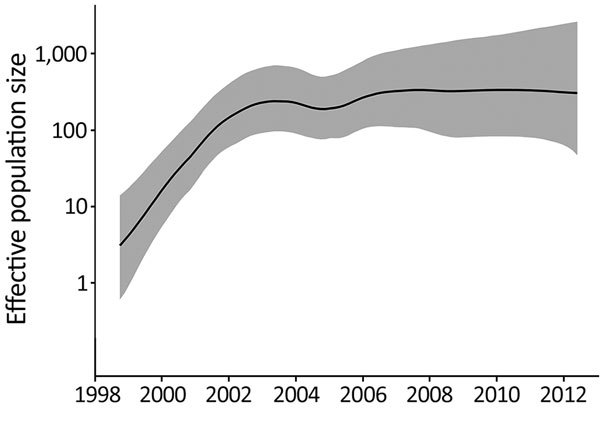
Figure 2.

Relative effective population size (log scale) of Salmonella enterica serovar Typhimurium DT160 during an outbreak in New Zealand, 1998–2012. Population parameters were estimated using the Gaussian Markov random field Bayesian skyride model. The black line represents the median effective population size estimate; gray shading represents the 95% highest posterior density interval.
