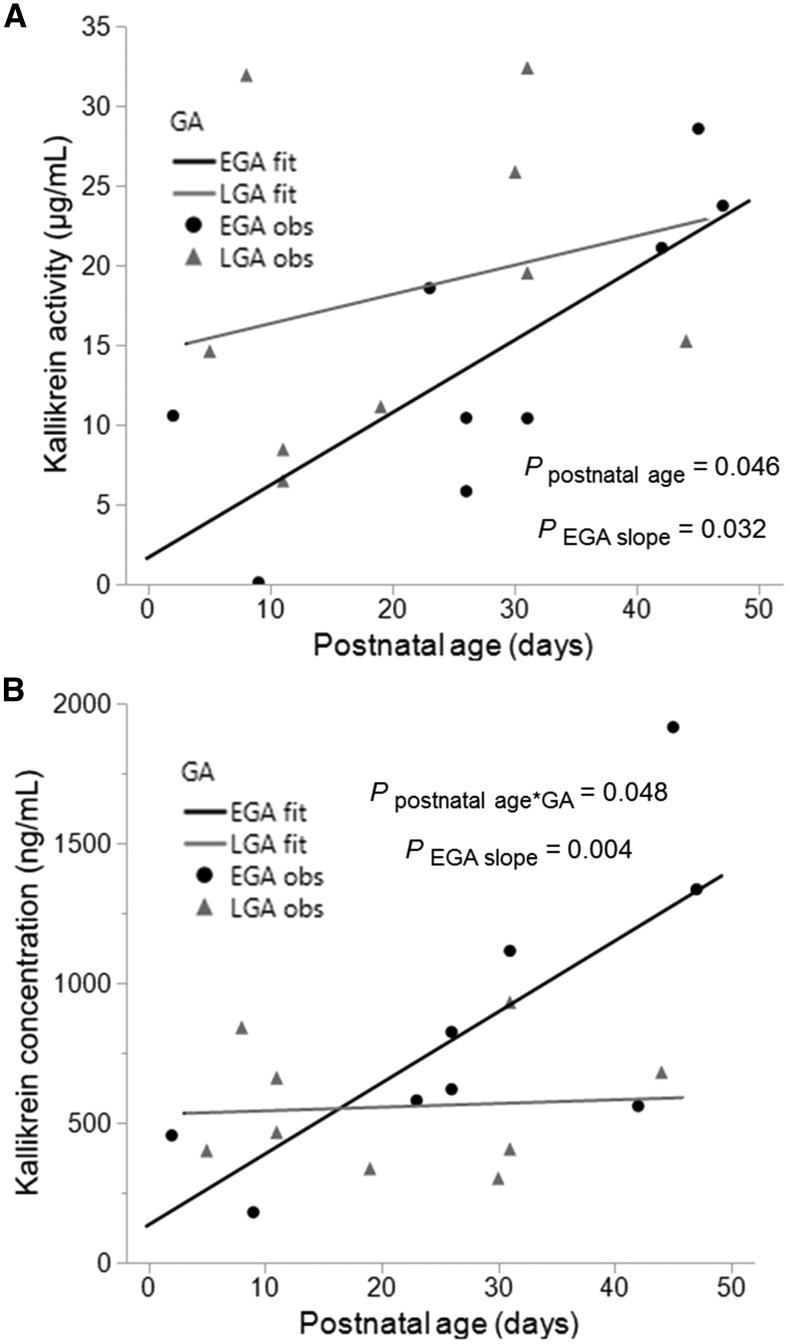
FIGURE 1.
Changes of kallikrein activity (A) and concentration (B) in milk from mothers who delivered at an EGA (24–26 wk GA) and LGA (27–32 wk GA) across postnatal ages 2–47 d. Line plots were used to estimate the slopes of EGA and LGA milk samples across postnatal ages (n = 9 per group). EGA and LGA fit represent the line plots for each group, and EGA and LGA obs represent each data point within each group. For panel A, Ppostnatal age represents the P value of the effect of postnatal age on kallikrein activity for EGA and LGA samples combined, and PEGA slope represents the P value of postnatal age on kallikrein activity for EGA samples alone; for panel B, Ppostnatal age*GA represents the P value of the interaction between postnatal age and GA on kallikrein concentration, and PEGA slope represents the P value of postnatal age on kallikrein concentration for EGA samples alone. EGA, early gestational age; GA, gestational age; LGA, late gestational age; obs, observation.

