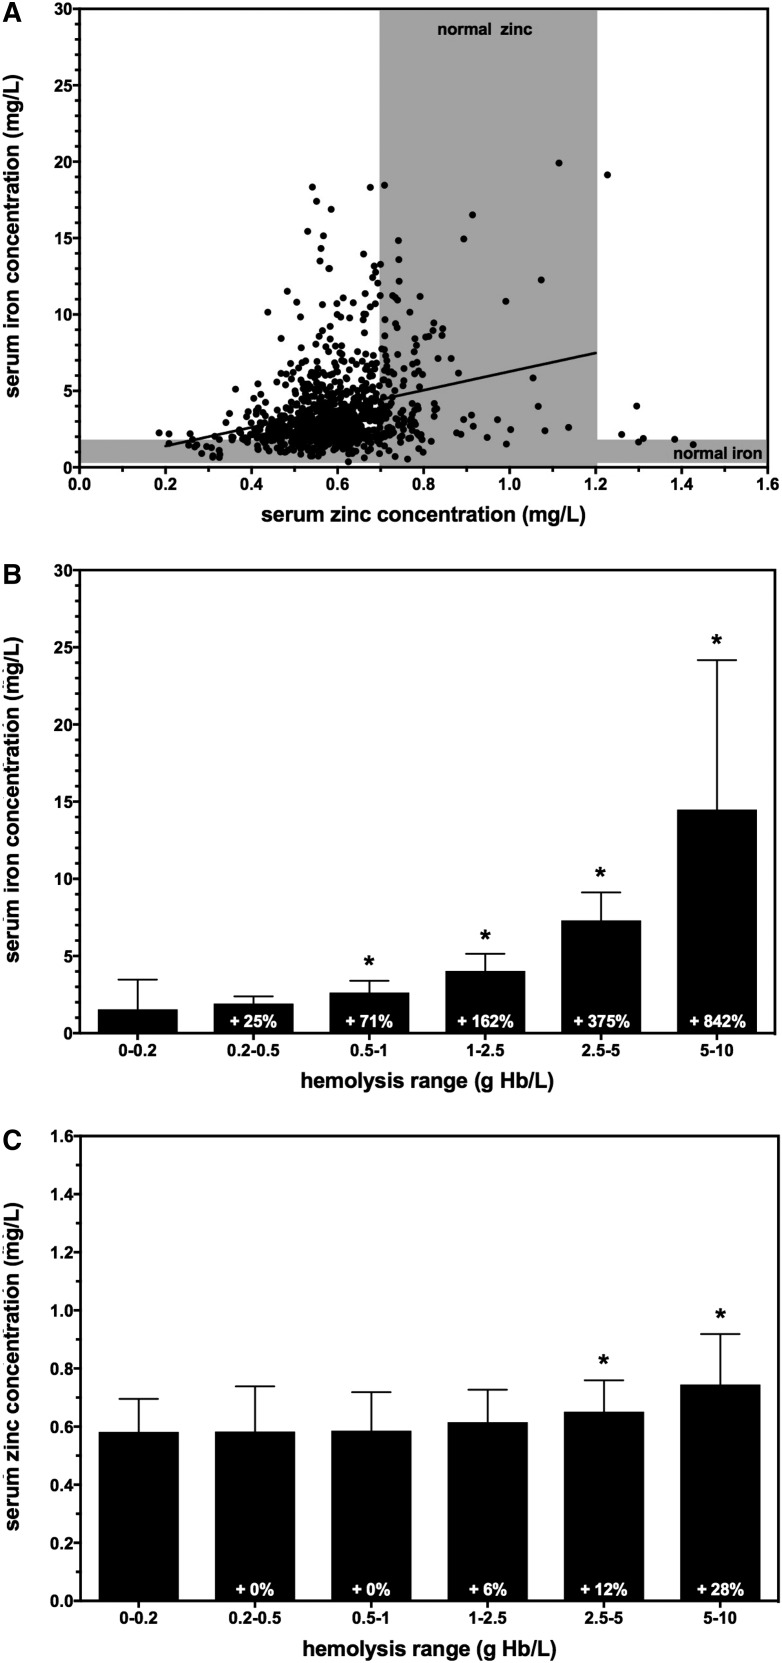
FIGURE 2.
Effects of hemolysis on serum iron and zinc concentrations in a population nutritional survey. (A) Iron and zinc concentrations were plotted for each serum sample. Gray shading indicates the clinical reference range for serum iron and zinc concentrations as indicated (20). Data were fit to a linear function (solid line, R2 = 0.104). (B) Serum iron concentrations increased as a function of hemolysis range grouping on the basis of hemoglobin concentration. Values are means ± SDs, n = 46–289. (C) Serum zinc concentrations increased as a function of hemolysis range grouping on the basis of hemoglobin concentration. Values are means ± SDs, n = 46–288. *P < 0.05. Hb, hemoglobin.

