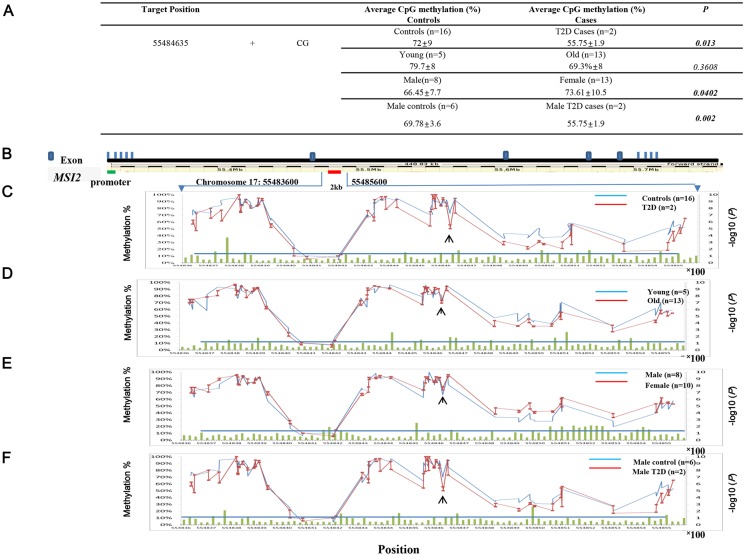
Fig 3. DNA methylation mapping of MSI2 in human pancreatic islets.
A. Estimate of the average methylation of chr17:55484635 (chromosome 17:55484635) and the complimentary CpG site (chromosome 17:55484636) in controls (n = 16) and T2D subjects (n = 2). The p values are given. B. Schematic MSI2 gene structure was described with 13 exons. DNA methylation map of the 2 kb region (chromosome 17:55483600 to 55485600) centered on the target site (chr17:55484635). C. The average normal methylation values (n = 16) from chr17:55483600 to chr17:55485600 are graphed in blue and the average T2D methylation values (n = 2) are in red. The—log10 (P) of 86 DMPs is indicated by the green bar on the bottom of the methylation curve. The line at -log10 (p value = 0.05) shows the cutoff for statistical significance. The arrow indicates the position at chromosome 17:55484635. D. Differential methylation map drawn after classifying 18 islets into cases and controls by age (“young” < 40 yrs and “old” > 40 yrs). The average methylation values of young islets (n = 5) are graphed as controls in blue, and those of old islets (n = 13) are shown as cases in red. E. Differential methylation map drawn after classifying 18 islets into cases and controls by gender (“male” and “female”). The average methylation values of male islets (n = 8) are graphed in blue, and those of female islets (n = 10) are shown in red. F. Differential methylation map drawn after classifying 8 male islets into T2D cases and controls after sex matching. The male T2D cases (n = 2) are shown in red, and the male controls (n = 6) are in blue.

