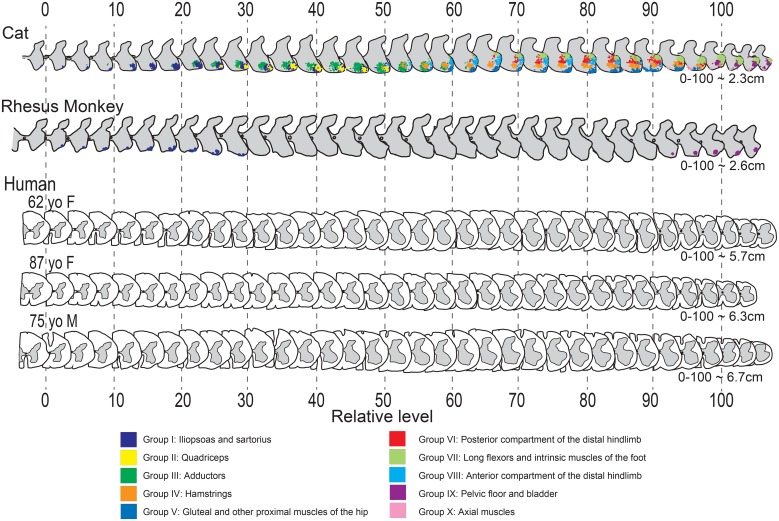
Fig 3. Schematic drawings of lumbosacral enlargement sections in cat, monkey and human aligned via internal landmarks.
Each schematic drawing represents the right side of every third section in a 1:5 series of 80μm sections (M5) or in a 1:6 80μm series in all 3 human cases. Cat data, with motoneuronal cell groups serving functionally distinct muscles marked by distinct colors, was adapted with permission from Vanderhorst and Holstege [13]. In all 3 species, series were aligned according to rostral (level 0) and caudal (level 100) anatomical landmarks as defined in Fig 1. Lengths signify distances calculated in centimeters from level 0 to 100, based upon the thickness of each section and the number of sections, and after corrections for tissue shrinkage. Note that consistent changes in ventral horn shape are congruent across all 3 species, and among the 3 human subjects, despite obvious differences in size.

