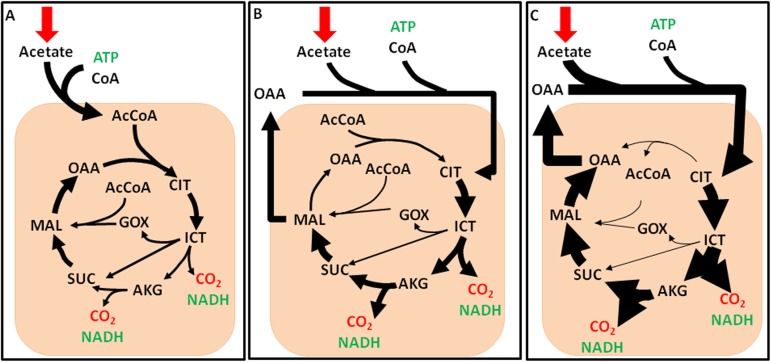
Fig 6. Comparison of TCA cycle fluxes calculated by flux balance analysis with metabolic flux analysis.
(A) FBA fluxes with maximum biomass as the objective function. (B) 13C-MFA calculated fluxes. (C) FBA fluxes with maximum ATP production as the objective function. The thickness of the arrow in panels A-C depicts the amount of flux through the reaction.

