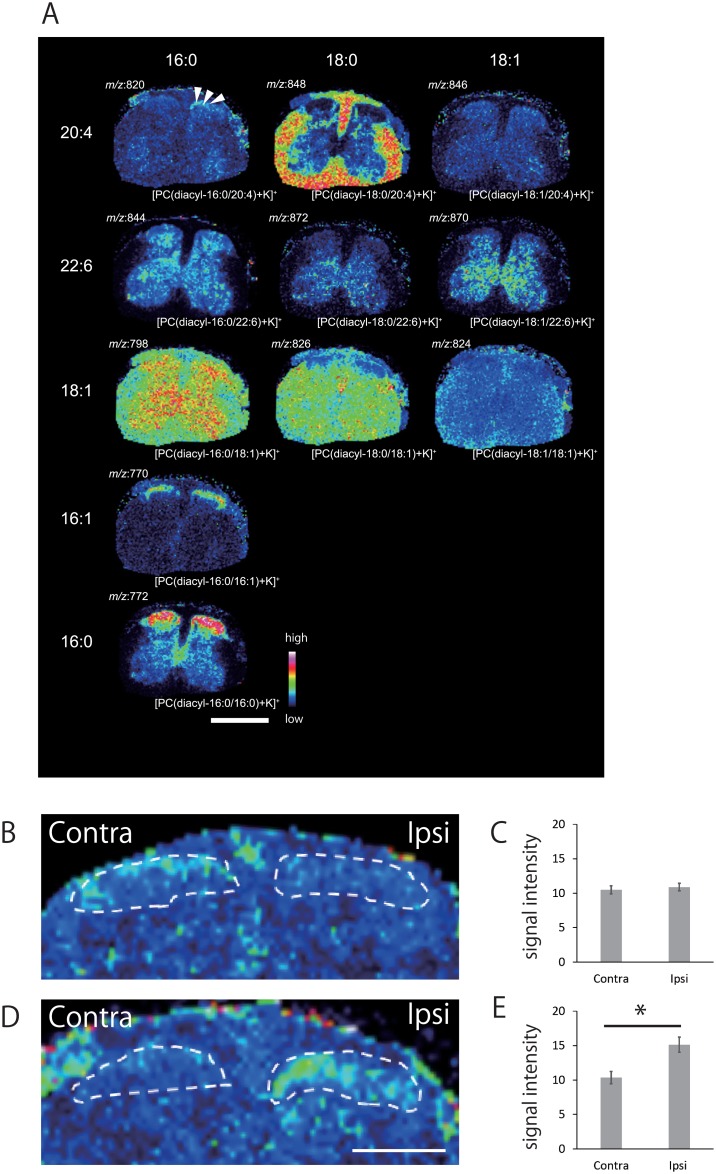
Fig 1.
(A) Differential distribution of PCs in the spinal cord section obtained from 7 days after SNI mice. PCs were visualized as ion image of spinal cord section. PCs with identical FA compositions at the sn-1 position are placed horizontally, while those with identical FA compositions at the sn-2 position are arranged vertically. [PC(diacyl-16:0/20:4)+K]+ showed specific increase in the ipsilateral dorsal horn compared with the contralateral side (arrowheads). The other PCs showed no significant elevation in the ipsilateral side. Scale bar: 1mm. (B~E) Statistical analysis for [PC(diacyl-16:0/20:4)+K]+ distribution in the spinal dorsal horn section at 7 days after the initial operation. No changes were observed in sham group (B, C). After SNI, ion signal intensities significantly increased in the ipsilateral dorsal horn compared with the contralateral side (D, E). This increase was present in every animal of both groups. *p<0.05 Welch’s t test. (n = 4 for both SNI and sham). All error bars represent SEM. Scale bar: 500μm

