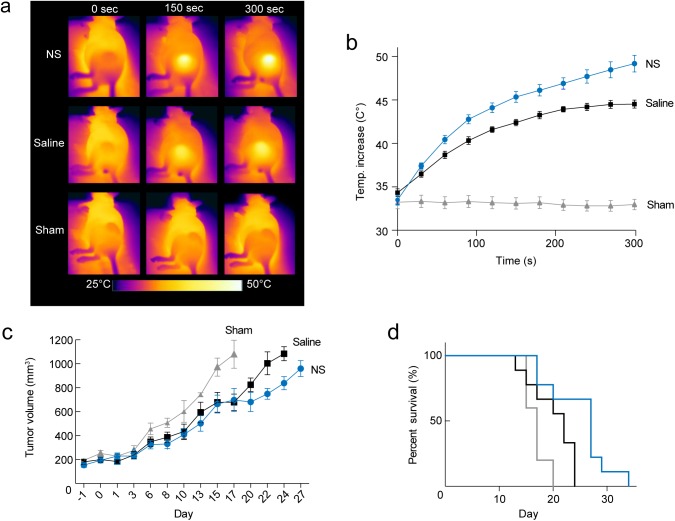
Fig 2. Evaluation of photothermal treatment.
(a) Representative thermographic images showing the temperature at the surface of the tumor during 5 min treatment of animals from each group. (b) Mean temperature at the tumor surface as a function of time for all animals included in the study, i.e., PET and survival evaluation, immunohistochemistry, and autoradiography. (c-d) The tumors that were treated with NS and laser showed a delayed growth and improved survival compared to the saline and sham groups. In (b-d) data shown in blue circles/lines; n = 9 represents the NS group, data shown in black squares/lines; n = 9 represents the saline group, and data shown in grey triangles/lines; n = 5 represents the sham group. Data shown is mean ± S.E.M. Each growth curve in (c) is shown until n = 3.

