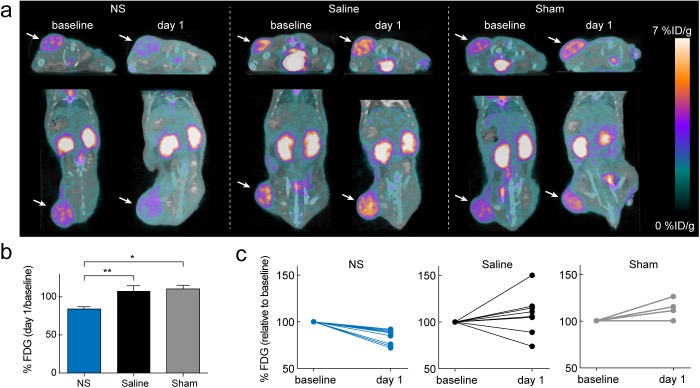
Fig 3. PET-based treatment evaluation.
(a) Representative 18F-FDG-PET/CT images showing an animal from each group at baseline and day 1. Tumors are marked by white arrows. The 18F-FDG uptake is markedly reduced at day 1 compared to baseline for the NS treated animal. (b) The mean 18F-FDG uptake at day 1 relative to baseline for all three groups. * denotes p value < 0.05, ** denotes p value < 0.01 and data represents mean ± S.E.M. (c) The individual 18F-FDG uptake at day 1 relative to baseline for the NS group (blue; n = 9), saline group (black; n = 9), and sham group (grey; n = 5).

