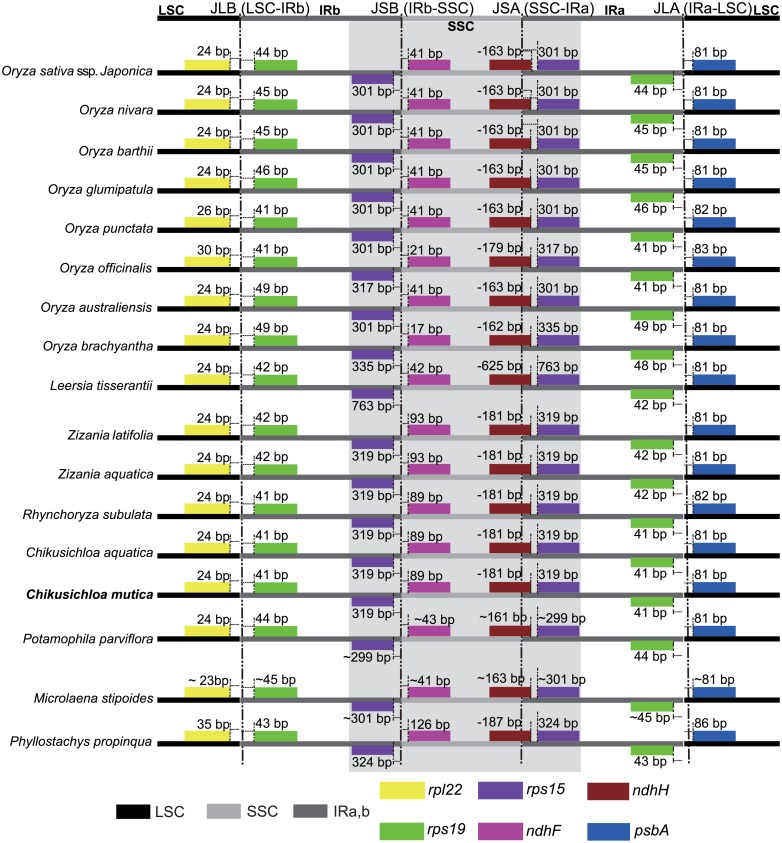
Fig 2. The variations of border distances between adjacent genes and four junction regions among 16 grasses’ chloroplast genomes.
Boxes above or below the main line indicate the adjacent border genes, which were represented by the different colored boxes at the bottom. The LSC, SSC and two IR regions were also color coded. The distance is not scaled with sequence length.

