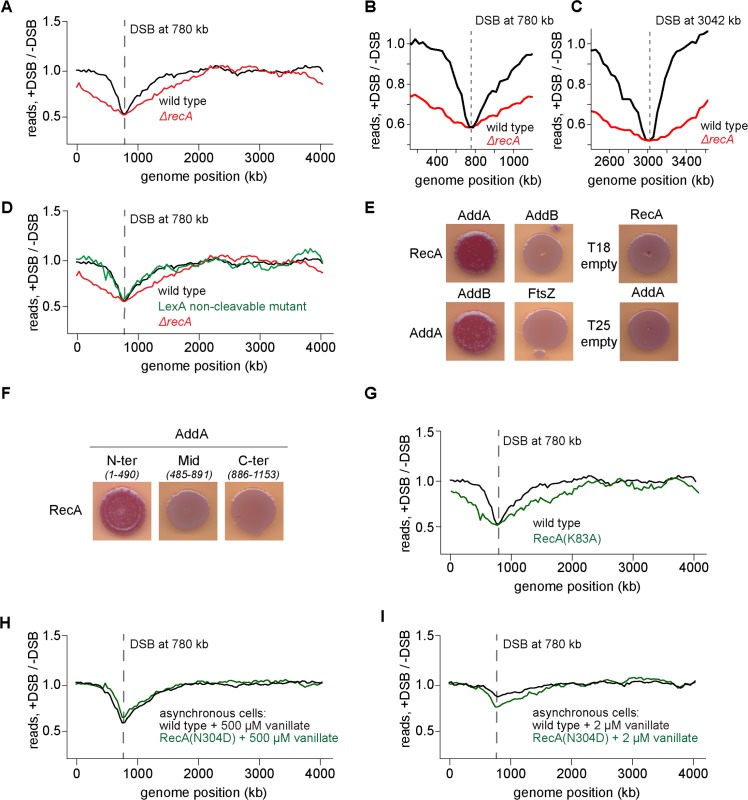
Fig 3. Effect of chi sites on AddAB is dependent on RecA.
(A) Representative DSB processing profile for a DSB induced at +780 kb from the origin 1 h after I-SceI induction with (black) or without (red) RecA. Location of the DSB site is indicated with a dashed line. The wild-type profile is from Fig 1B. (B) Zoomed in profile for a DSB induced at +780 kb 1h after I-SceI induction with (black) or without (red) RecA. (C) As (B) for a DSB induced at +3042 kb. (D) Profile of a non-cleavable mutant of LexA (green) is shown. Profiles of wild type (black) and ΔrecA (red) are from Fig 3A. (E) Bacterial-two-hybrid assay showing RecA interaction with AddA, but not AddB. Empty vector controls are also shown. (F) Bacterial-two-hybrid assay with fragments of AddA. Amino acid positions for each fragment are indicated in parentheses. (G) DSB processing profile of a predicted RecA ATPase mutant, RecA(K83A) (green). The wild type profile (black) is from Fig 1B. (H) Profile of a predicted RecA recombination deficient mutant, RecA(N304D) (green). The wild-type profile (black) is from Fig 1E. In both cases, asynchronously growing, replicating cells were induced with 500 μM vanillate for 1h. (I) Same as panel H but for asynchronously growing, replicating cells induced with 2 μM vanillate for 1 h.

