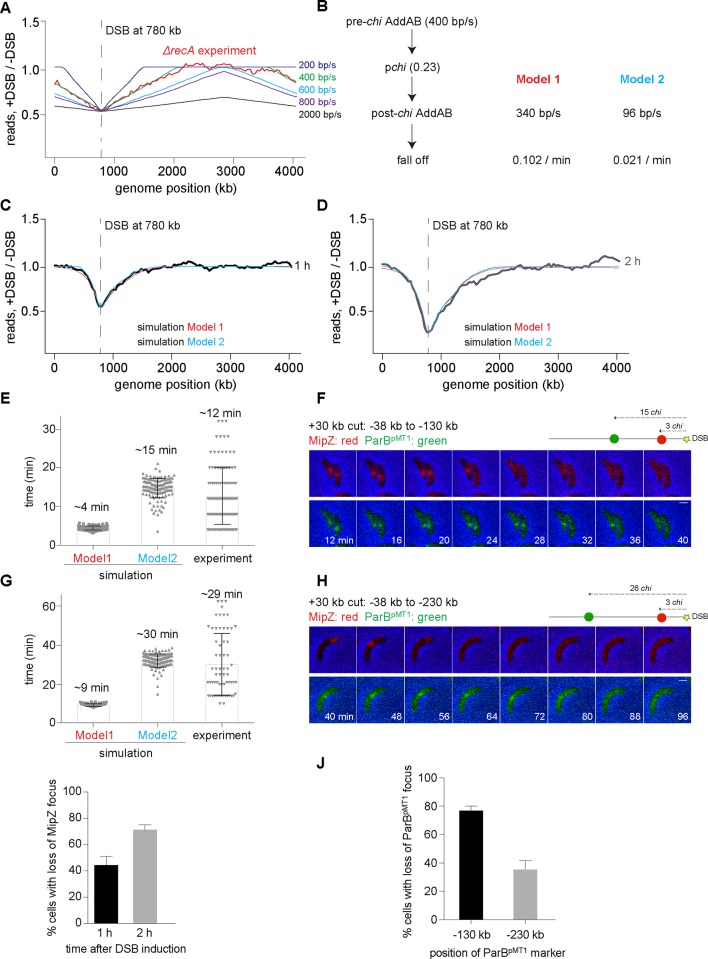
Fig 4. AddAB-dependent DNA processing is attenuated after chi recognition.
(A) Example simulation profiles obtained by scanning for parameters that match the measured ΔrecA profile. The translocation rates for B. subtilis AddAB in vitro [16,24,39] are in green (pre-chi AddAB degradation rate– 400 bp/s) and black (pre-chi AddAB degradation rate– 2000 bp/s). In all cases, the chi recognition probability was ~0.23 and post-chi AddAB speed was reduced by 15%. The average profile from simulations of 10,000 independent cells treated for 1 h is shown. The ΔrecA profile (red) is from Fig 3A. (B) Schematic summarizing the possible models and parameters for describing the in vivo profiles of wild-type cells. (C-D) Simulation profiles obtained for Model 1 (red) and 2 (blue) that best fit the in vivo DNA degradation profiles for a DSB induced at +780 kb for 1 h and 2 h samples respectively. Experimental profiles from Fig 1 are overlaid in black and grey. (E) Histograms showing the predicted degradation rates from simulations of Model 1 and 2, and the experimentally obtained degradation rates between fluorescent loci at -38 kb and -130 kb for a DSB induced +30 kb from the origin. Each grey dot represents the value determined from an individual cell. The mean is reported above each bar. (F) Montage of representative cells showing the loss of fluorescent foci at -38 kb (MipZ, red) and -130 kb (ParBpMT1, green) after a DSB was induced +30 kb from the origin. Time is indicated in the frames. Schematic of DSB site (yellow) along with the location of the -38 kb and -130 kb markers are shown and number of chi sites between the DSB site and these positions is indicated. (G-H) Same as panels E-F, but for fluorescent loci at -38 kb and -230 kb for a DSB induced +30 kb from the origin. (I) Percentage of cells with the loss of a MipZ focus (-38 kb from the DSB site) 1 or 2 h after break induction. (J) Percentage of cells with loss of a ParBpMT1 marker -130 kb or -230 kb from the DSB site in those cells where the MipZ focus has been lost.

