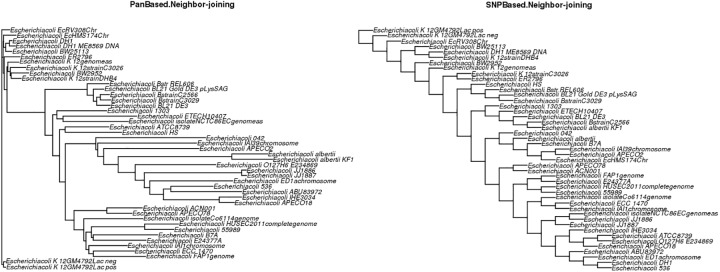
Fig 2. Phylogenetic trees based on the NJ algorithm.
Phylogenetic trees showing species evolution analysis for the 45 strains based on the NJ algorithm. The left graph is based on the gene distance matrix for core gene clusters, and the right graph is based on indel variations in core-gene clusters.

