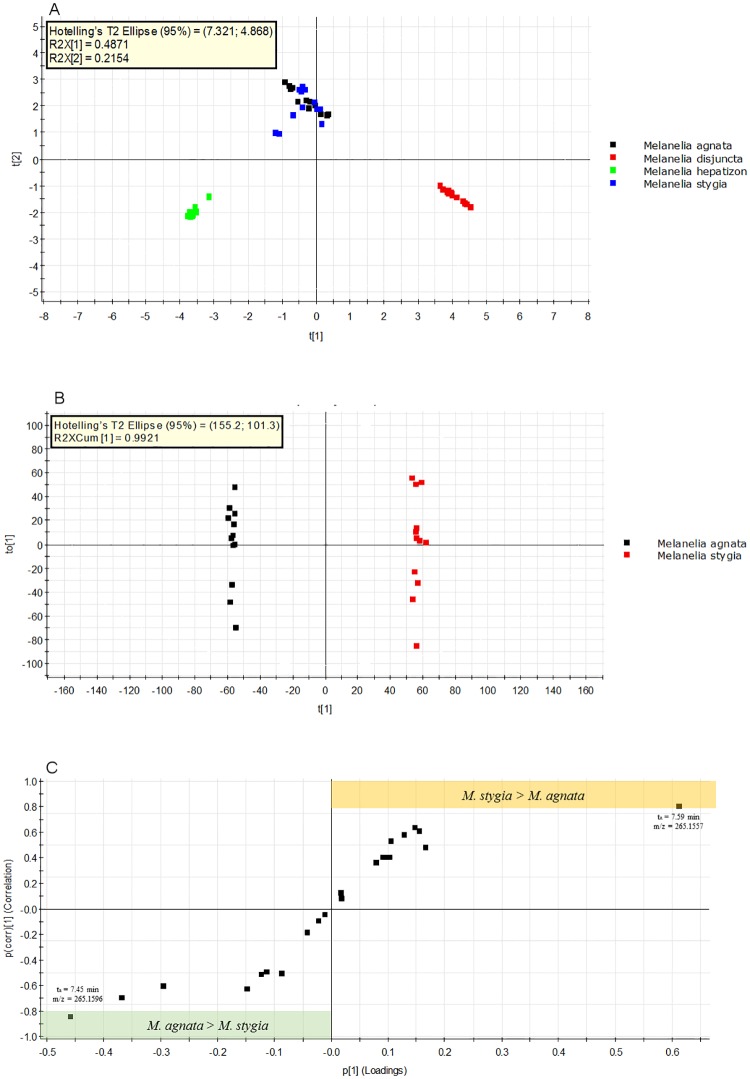
Fig 7. Multivariate analysis of LC-MS metabolite data.
(A) PCA plot of chemical profiles of Icelandic Melanelia lichens, where M. agnata and M. stygia are clustered. (B) OPLS-DA plot shows the separation of the two Melanelia taxa. The metabolome of M. agnata and M. stygia can be differentiated with a high level of prediction value: R2Y(cum) = 1, Q2(com) = 0.99. (C) Loading S-plot from LC-MS data of M. agnata and M. stygia. Cut-off values of p(corr) < |0.8| were selected to designate the metabolites contribuiting significantly to the overall difference (area in color) between M. agnata and M. stygia. Two metabolites were thus identified from each species.

