
Figure 4. Biventricular TRP expression and hemodynamics following 8 weeks of RV pressure overload.
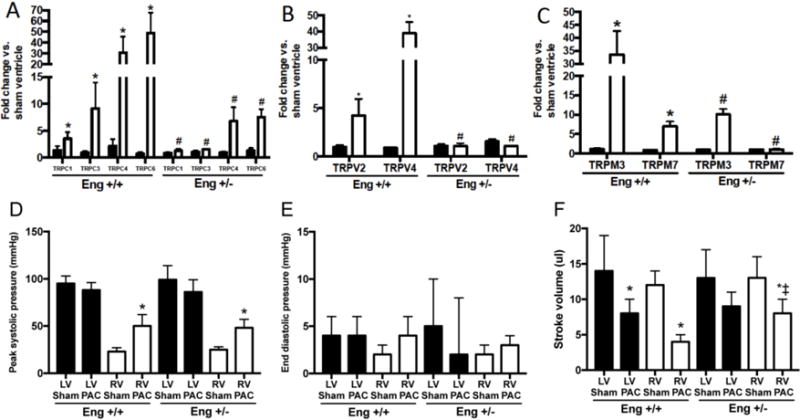
mRNA expression levels of TRPC (A), TRPV (B) and TRPM (C) in the LV (closed bars) and RV (open bars) following 8 weeks of PAC. Data are expressed as fold change compared to sham operated ventricle. p<0.05: *, vs. Sham operated corresponding ventricle; †, vs. Eng +/+ PAC LV; ‡, vs. Eng +/− PAC LV; #, vs. Eng +/+ PAC RV; %, vs. Eng +/− PAC RV. Peak systolic pressure (D), end diastolic pressure (E) and stroke volume (F) were measured under steady state conditions. p<0.05: *, vs. Sham operated corresponding ventricle; †, vs. Eng +/+ Sham operated corresponding ventricle; ‡, vs. Eng +/+ TAC corresponding ventricle