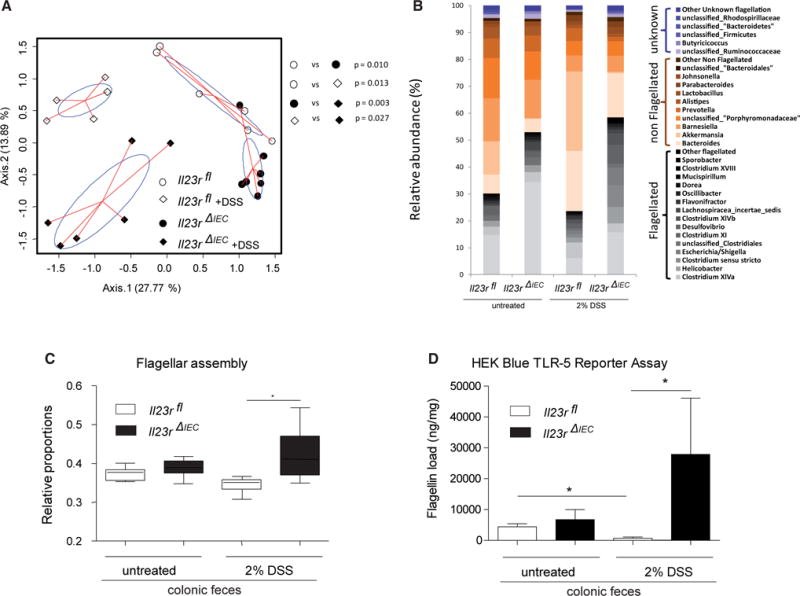
Figure 2. Epithelial IL-23R Controls Microbial Expansion of Flagellated Bacteria in DSS Colitis.

(A) PcoA of 16S rDNA sequences was performed on Bray Curtis distance matrices calculated on log-transformed species level (97% similarity) operational taxonomic unit (OUT) abundance data. p Values were generated by NPMANOVA.
(B) Abundances of dominant bacterial groups (genus level) before and after DSS treatment in the feces of Il23rfl and Il23rΔIEC mice according to inferred flagellation status (flagellated, non-flagellated, or unknown; see the Supplemental Experimental Procedures for details) in response to DSS.
(C) Bar plot showing the relative proportion of genes assigned to flagellar assembly pathways in Il23rfl and Il23rΔIEC animals at baseline and after DSS treatment (PICRUst algorithm). The median, lower, and upper quartiles are shown. Asterisks indicate significant differences (one-way ANOVA followed by Tukey-Kramer multiple comparison test and Welch’s test for two groups (*p < 0.05). See the Supplemental Experimental Procedures for details regarding phylogenomic analyses.
(D) Load of fecal flagellin measured in Il23rfl and Il23rΔIEC mice before and after induction of colitis as measured by TLR5 reporter assay (HEK Blue cells) (Cullender et al., 2013). Data are representative of minimum of n = 3 male animals per group.
