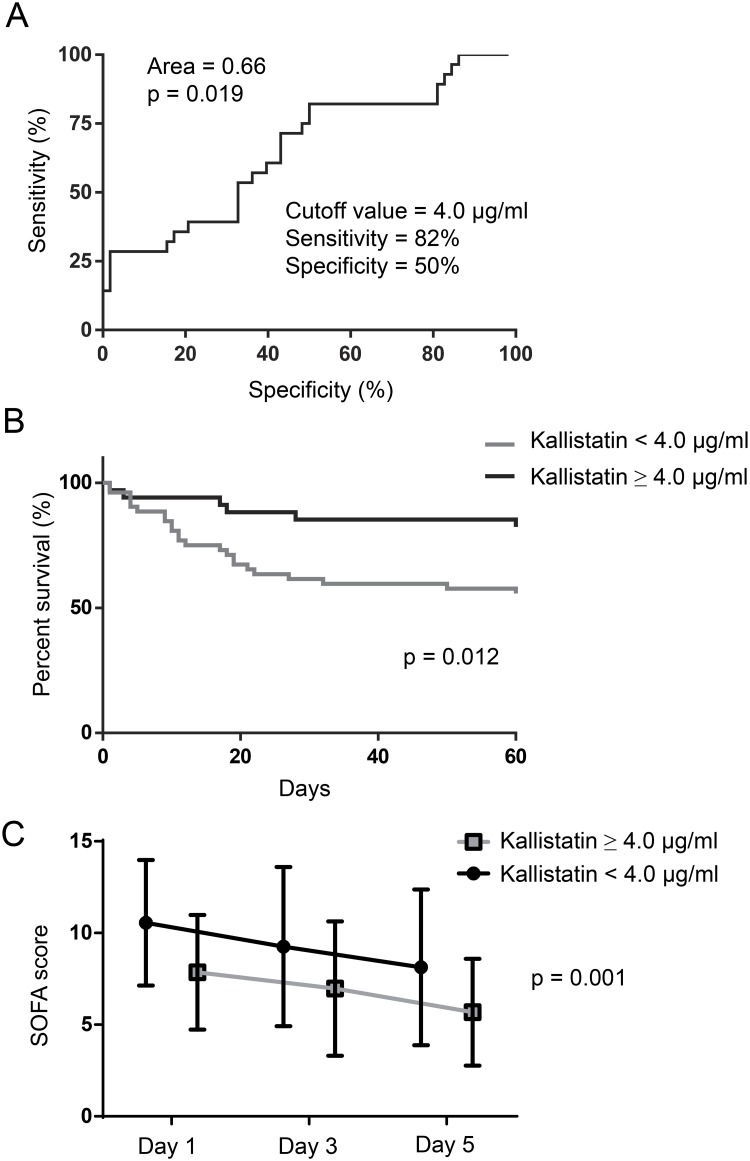
Fig 3. ROC curve and Kaplan-Meier curve analyses for 60-day mortality and stratified SOFA scores for days 1–5 days related to plasma kallistatin levels on day 1 of ICU admission in severe sepsis and septic shock patients.
(A) ROC curves determining the cutoff value of day 1 kallistatin (4.0 μg/ml) to discriminate between survivors and nonsurvivors. (B) Kaplan-Meier curves of 60-day survival with patients grouped according to day 1 kallistatin levels ≥ 4.0 μg/ml or < 4.0 μg/ml. Log-rank test for comparisons between groups. (C) SOFA scores on days 1, 3, and 5 in patients grouped according to day 1 kallistatin levels ≥ 4.0 μg/ml or < 4.0 μg/ml. Mixed model comparisons between groups.

