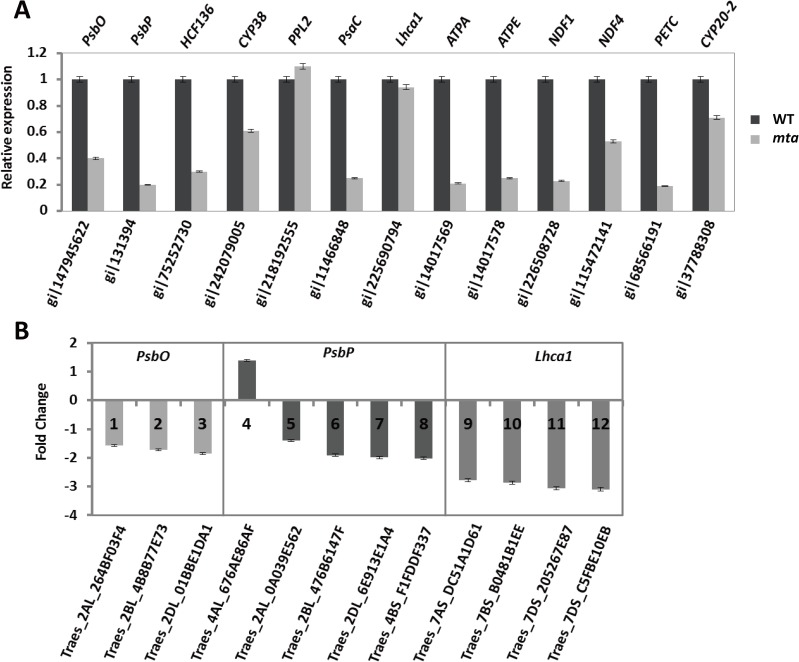
Fig 7. Quantitative real-time PCR analysis of 13 DEP-coding genes.
The relative gene expression levels of selected target genes were normalized to a BestKeeper composed of the endogenous reference gene TaActin. (A) The black and gray bars represent WT and mta, respectively. Low values indicate down-regulation in mta, while high values indicate up-regulation. (B) The different colors represent 12 DEGs, including PsbO (1–3), PsbP (4–8), Lhca1 (9–12). Positive values indicate higher expression in mta and negative values denote higher expression in WT. Error bars represent the standard deviation.

