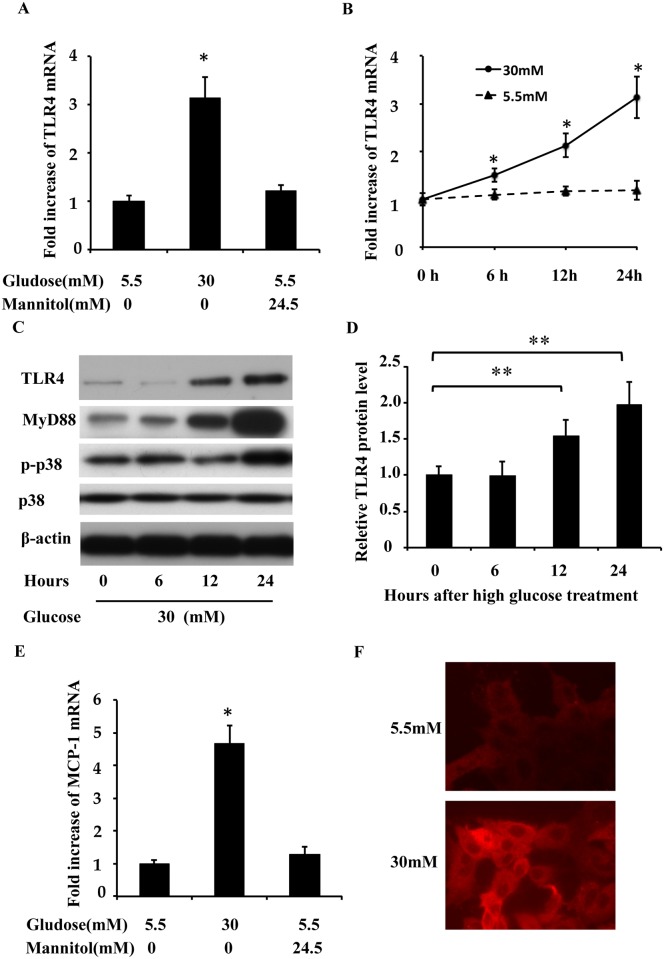
Fig 3. TLR4 upregulation during high glucose treatment in RPTC.
TLR4 mRNA and protein levels were examined via real-time PCR and Western blotting after low gucose or high glucose treatment. (A and B) TLR4 mRNA upregulation in the high glucose medium. (C) TLR4 protein levels increased after the high glucose treatment. (D) Experiments were analyzed via densitometry and normalized to the control (0 h). (E) MCP-1 mRNA upregulation in high glucose medium for 24 h. (F) Immunofluorescence analysis of TLR4 expression. PRTC cells were cultured for 2 days in low glucose (5.5 mM) or high glucose (30 mM) medium.The cells were fixed for immunofluorescent staining of TLR4 (red). Data are expressed as the mean ± S.D. (n≥3). *, p<0.05 versus the low glucose group; **, p<0.05 versus the control (0 h).

