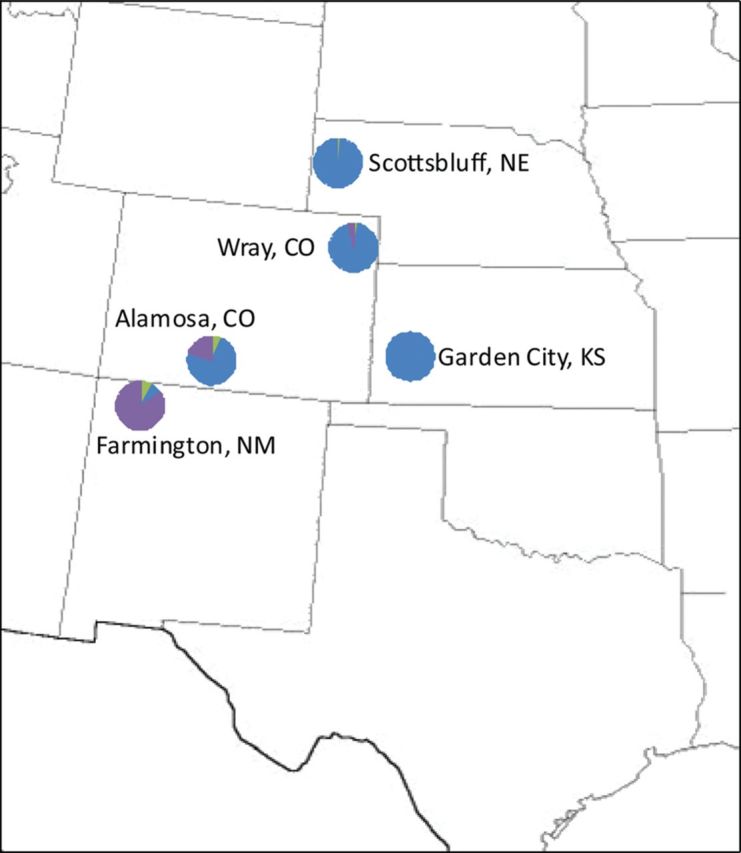
Fig. 5.

Geographical distribution of the four psyllid haplotypes. Haplotyping results of potato psyllids collected in New Mexico, Colorado, Nebraska, and Kansas are depicted on the U.S. map by pie charts. These pie charts depict the percentage of each haplotype identified at each location, independent of psyllid number. The Central haplotype is depicted in blue, the Western in green, and the new, Southwestern haplotype in purple.
