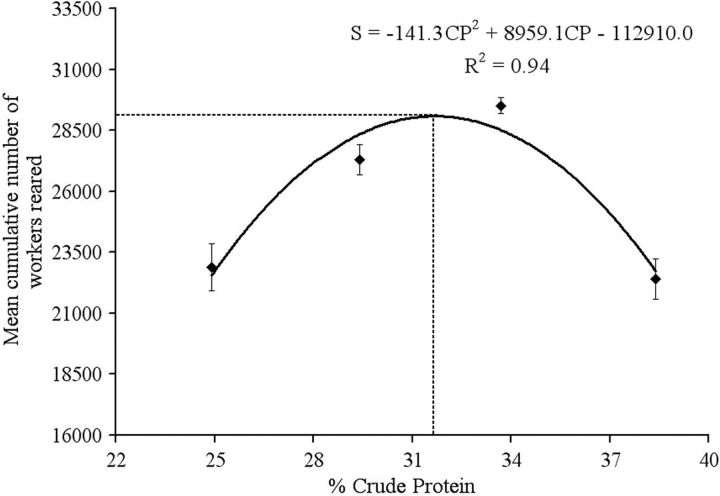
Fig. 5.
The mean cumulative numbers (±SE) of workers produced by the colonies fed with different protein levels (25.0, 29.5, 34.0, and 38.5%) for 48 d ( N = 5 colonies per treatment). The crude protein content yielding the maximum number of brood was calculated from the regression coefficients as follows: 8 959.1/(2 by 141.3) = 31.7 (dashed line).

