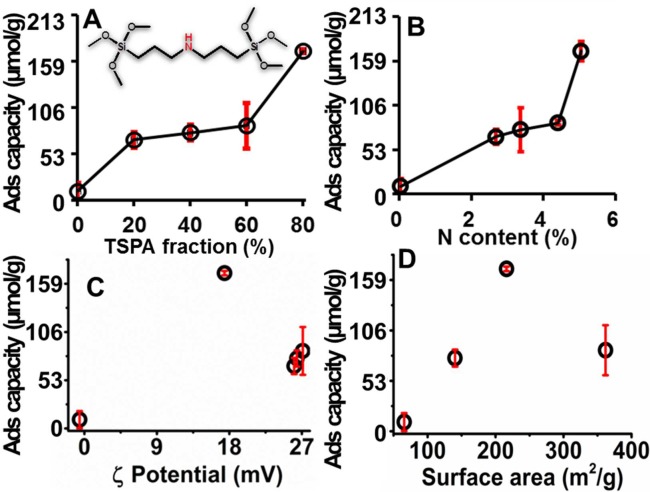
Figure 2.
Phenol red adsorption capacity of OSNPs. Capacity changes with (A) TSPA, (B) nitrogen content, (C) zeta potential, and (D) BET surface area. Of the four parameters, the adsorption capacity is only positively dependent on the TSPA and nitrogen content. Error bars represent the standard error for more than 3 measurements (RT, t = 16 h, 5 mg OSNP, 0.5 mg/mL or 1.33 mM phenol red). Samples with more positive zeta potential sequestered more phenol red, but no further increase in adsorption capacity when the zeta potential was over 20 mV. The adsorption capacity increased up to a surface area of 220 m2/g and then decreased with increasing surface area.

