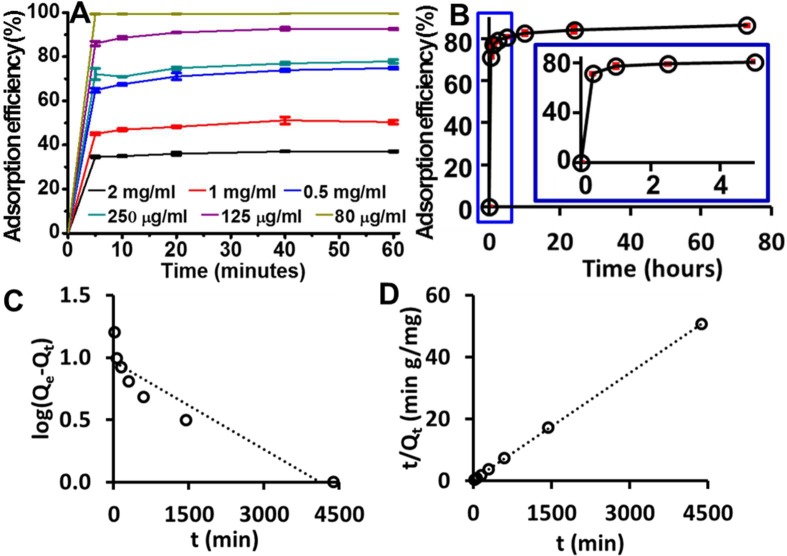
Figure 7.
Adsorption kinetics. (A) Short-term adsorption efficiency of phenol red by OSNP is different when the dye concentration changes. The adsorption efficiency decreases as the dye concentration increases. (B) Long-term adsorption when the dye concentration is 0.5 mg/mL (1.33 mM) (pH = 7, RT, 0.75 mg of OSNP). The inset shows the PR adsorption within the first 5 h. The axes on the inset are the same as in the larger data set. Most adsorption happened within the first 30 min. More dye can be sequestered slowly over the subsequent 3 days. Error bars represent the standard deviations for 3 measurements. Plots based on (C) pseudo-first-order and (D) pseudo-second-order adsorption models show that the pseudo-second-order adsorption model is a better fit for the phenol red adsorption.

