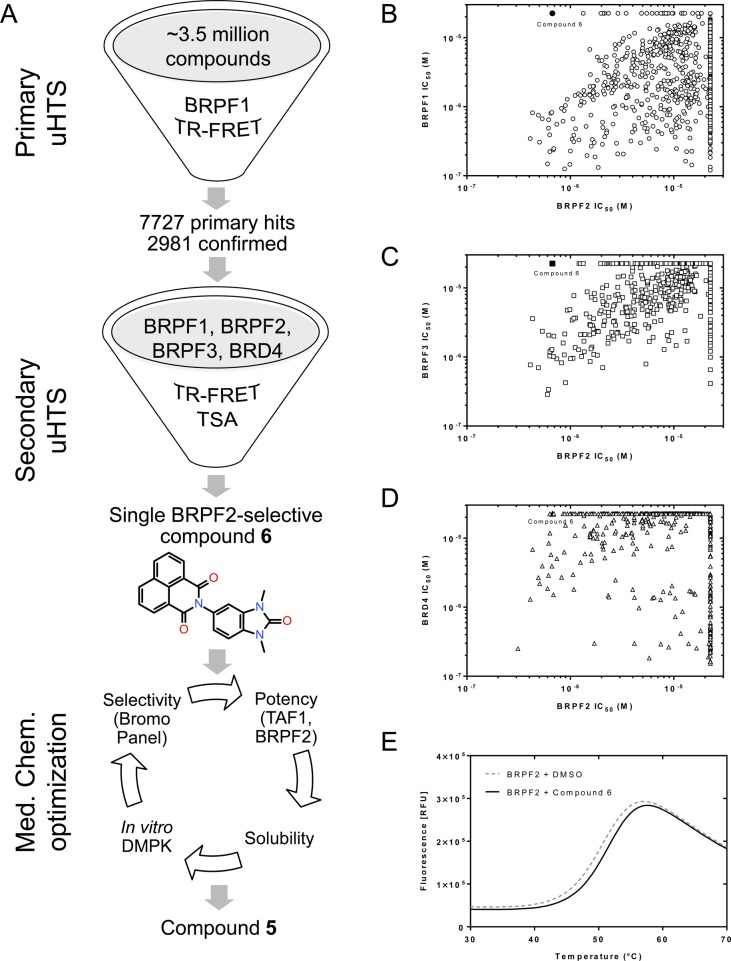
Figure 2.
Screening strategy for the discovery of 6 and identification of 5. (A) Overview of the HTS campaign leading to 6, and of the optimization process which culminated with the identification of the probe. (B–D) Potency correlation plots of HTS hits showing the BRPF2 selectivity of 5: TR-FRET IC50 values for BRPF2 (x-axis) compared with BRPF1 (B), BRPF3 (C), and BRD4 (D) IC50 values. Symbols corresponding to 6 are shown in black. (E) TSA melting curve of BRPF2 in the presence of 6 compared to vehicle.

