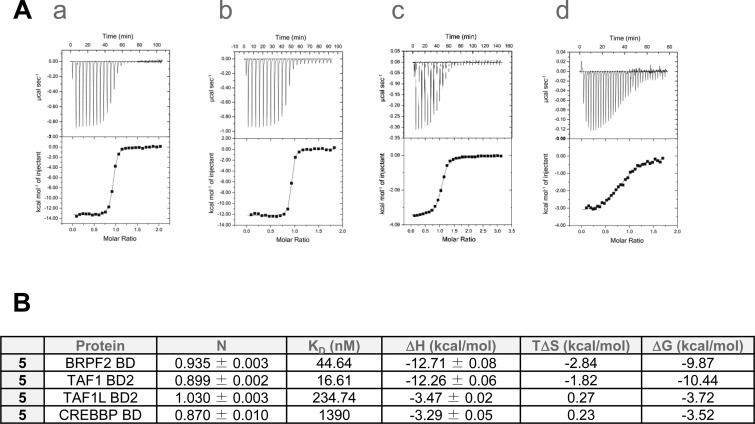
Figure 6.
ITC results for 5. (A) ITC binding study: data show raw injection heats for titration of protein into compound. The inset shows the normalized binding enthalpies corrected for the heat of protein dilution as a function of binding site saturation. Solid lines represent a nonlinear least-squares fit using a single-site binding model. (a) BRPF2 BD–5; (b) TAF1 BD2–5; (c) TAF1L BD2–5; (d) CREBBP BD–5. (B) Summary of ITC data.

