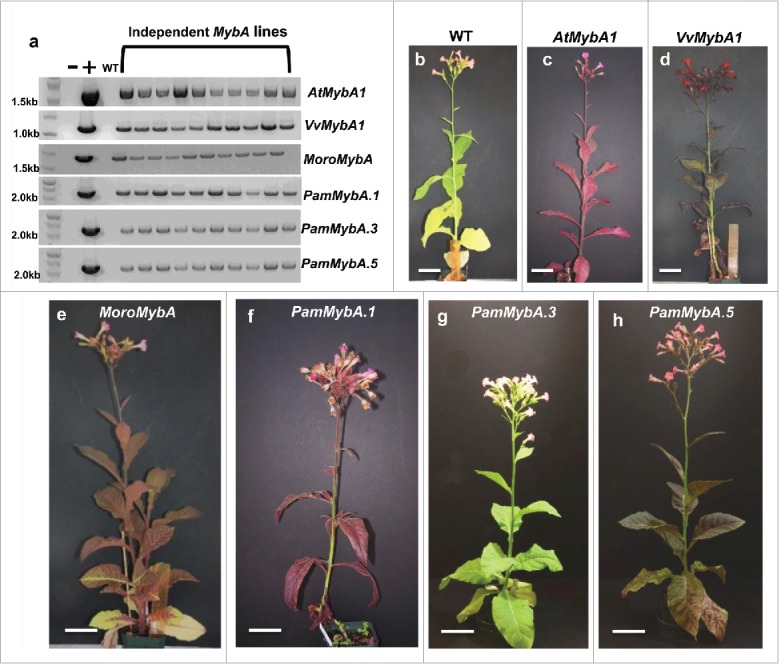
FIGURE 4.

Phenotypic and molecular analyses of the MybA transgenic tobacco plants. (a) PCR amplification showing the transgene's presence in independent lines. The no template (−), wild type (WT) and positive (+) plasmid DNA controls are also shown. The expected amplicon sizes are shown in supplemental Fig. S1. (b) Wild type and (c) representative AtMybA1 (d) VvMybA1 (e) MoroMybA (f) PamMybA.1 (g) PamMybA.3 and (h) PamMybA.5 mature T0 transgenic plants are shown.
