
FIGURE 6.
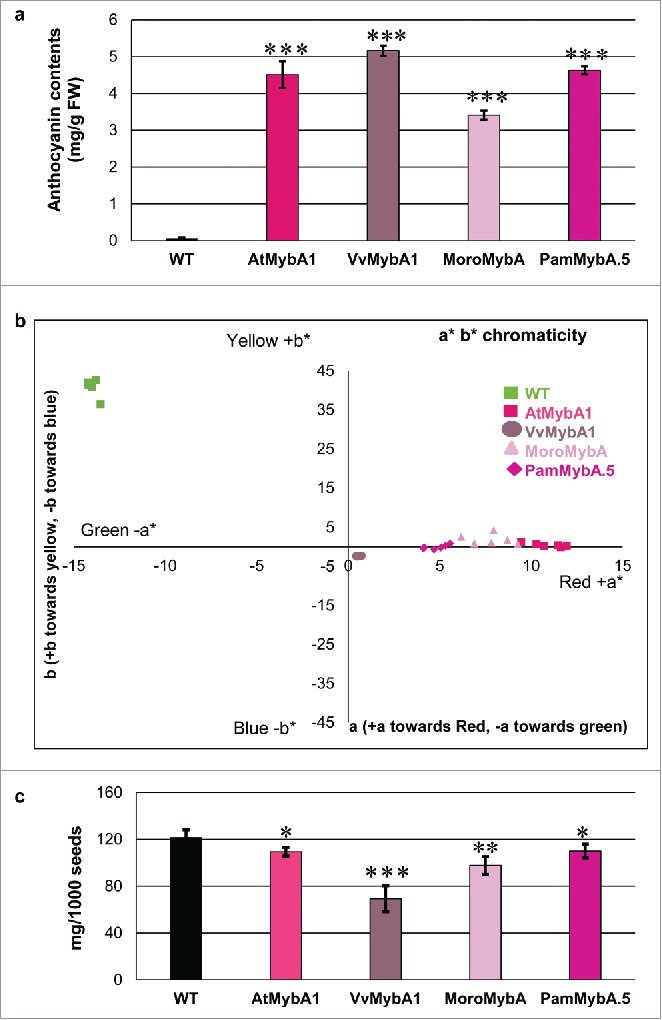
Phenotype analysis of the MybA transgenic tobacco lines (a) Anthocyanin quantification of leaf extracts from 50 day old transgenic tobacco plants. The total anthocyanin contents were spectrophotometrically determined by measuring the absorption of the extracts at wavelengths of 530nm and 657nm. The anthocyanin content of the transgenic samples were significantly higher than wild type (P<0.005) (b) Colorimetric analysis of transgenic tobacco leaves using leaf color measurement as a parameter to compare the intensity of anthocyanin accumulation. (c) Average seed yield represented as weight of 1000 seeds from wild type and transgenic tobacco lines. The error bars indicate the Standard Error of the 12 biological replicates and the Student's t test values are indicated * = P<0.5, ** = P<0.05 and *** = P<0.005.