
Extended Data Figure 5. Integrative analysis of allele-specific Hi-C, RNA-seq and ATAC–seq.
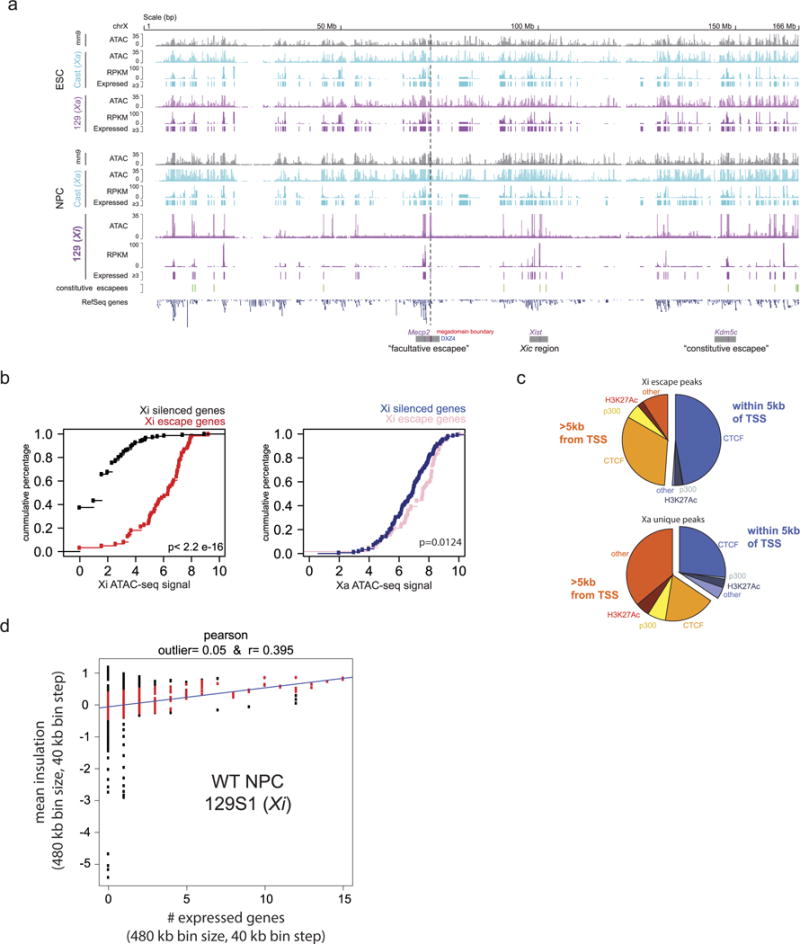
a, X-chromosome-wide ATAC–seq and RNA-seq in ES cells and NPCs. ATAC shows signal for ambiguous, 129- and Cast-specific reads in ES cells and NPCs. RNA-seq shows total signal as well as expressed gene calls. ATAC–seq shows global loss of chromatin accessibility and expression on the Xi chromosome, except at specific locations that mostly overlap with escape genes. Dotted line denotes megadomain boundary. Position of constitutive escapees was adapted from ref. 3. b, Escape genes on the Xi chromosome (as determined by RNA-seq) fall within regions with high ATAC–seq signal (Kolmogorov–Smirnov test P < 2.2 × 10⁻¹⁶). c, Pie charts showing the distribution of peaks that escape XCI versus the peaks that are unique to the Xa chromosome. Peaks are classified into those that are promoter-proximal (within 5 kb of TSS) and distal (>5 kb from TSS). Annotations are based on binding sites identified by ChIP–seq37,38. d, Scatter plot showing the relationship between TAD signal (insulation score) and number of expressed genes of the wild-type NPC 129 (Xi) Hi-C data set. The y axis shows the mean insulation score in a 480-kb window with a 40-kb step size. The x axis shows the number of expressed genes in a 480-kb window with a 40-kb step size. The Pearson R value (0.395) is shown above and is calculated on only the middle 90% (red points) of the residuals. Outliers are shown in black (bottom 5% and top 5% of residuals)